Reading...
![]()
Play button
![]()
Play button
![]()
Use LEFT and RIGHT arrow keys to navigate between flashcards;
Use UP and DOWN arrow keys to flip the card;
H to show hint;
A reads text to speech;
8 Cards in this Set
- Front
- Back
|
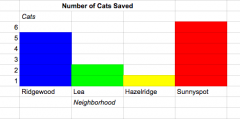
Bar Graph |
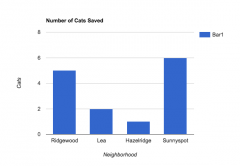
Displays the number of items in specific categorys |
|
|
Box and Whisker Plot |
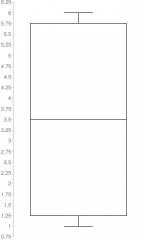
Displays a spread of data set by summerizing data using five values |
|
|
Circle Graph |
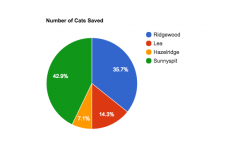
Compares parts to a whole
|
|
|
Frequency Table |
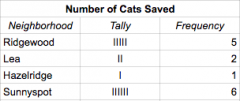
Displays the number of peices of data that fall within a given interval
|
|
|
Histogram |
Displays the frequency of the data divided into equal intervals. *Shows frequency distrubution
|
|
|
Line Graph |
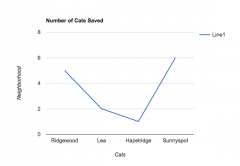
Displays change in data over time |
|
|
Line Plot |
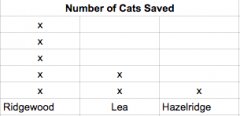
Displays number of times each nu,ber occurs in a data set |
|
|
Stem and Leaf Plot |
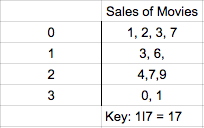
Lists all individual numerical data in condesed form |