Reading...
![]()
Play button
![]()
Play button
![]()
Use LEFT and RIGHT arrow keys to navigate between flashcards;
Use UP and DOWN arrow keys to flip the card;
H to show hint;
A reads text to speech;
120 Cards in this Set
- Front
- Back
|
GIS
|
System of computer software, hardware, data, and personnel which enables the manipulation, analysis and presentation of information that is tied to a spatial location
|
|
|
Map Scale
|
Ratio of distance on the map to distance on the ground
|
|
|
Small scale map
|
A large denominator gives a small fraction
|
|
|
Large scale map
|
A small denominator gives a larger fraction
|
|
|
Types of Maps
|
–Thematic maps
–Topographic maps –Physical maps –Network maps –Surface maps |
|
|
Thematic maps
|
Land cover, population, politics, etc
|
|
|
Network maps
|
Roads, rivers/streams
|
|
|
Surface maps
|
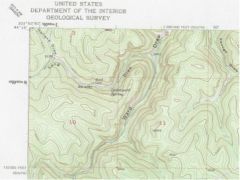
-Topographic maps
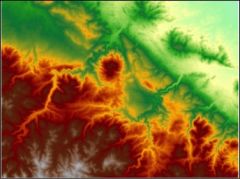
-Digital Elevation Model (DEM) |
|
|
Topographic maps
|
|
|
|
Digital Elevation Model (DEM)
|
|
|
|
Survey Instruments
|
-Transit
-Theodolite -Total Station -RTK GPS |
|
|
Components of spatial data
|
–Geometry: locations, shapes, and sizes
–Attributes: tables of information about features |
|
|
Vector
|
–points, lines, polygons
–discrete objects |
|
|
Raster
|
-grid (matrix) of cells
–each cell has a value |
|
|
Examples of Raster Data
|
-Elevation
Digital Elevation Models -Air photos orthophotographs -Satellite data visible, infrared, gravity |
|
|
Vector characteristics
|
-Usually complex
-Small for most datasets -Simple -Preferred for network analysis -Limited only by positional measurements (scale) |
|
|
Raster characteristics
|
-Usually simple
-Large for most data -May be slow and require resampling -Easy for continuous data, combining layers -Floor set by cell size |
|
|
Types of attributes
|
–Nominal (text)
–Ordinal (rank) –Interval (numeric) |
|
|
Nominal
|
Location name; address; description
|
|
|
Ordinal
|
Suitability (high, medium, low); importance
|
|
|
Interval/Numeric
|
Area, population, temperature, elevation
|
|
|
Large Scale Map
|

More detail, covers smaller area
|
|
|
Small Scale Map
|
Less detail, covers larger area
|
|
|
Scale Bars
|

|
|
|
Points
|
–Street address
–Earthquake epicenter |
|
|
Lines
|
–Roadways
–Stream network |
|
|
Polygons
|
–Political Boundaries
–watersheds |
|
|
Coordinate systems
|
–Cartesian
–Geographic |
|
|
Datums
|
–Horizontal
–Vertical |
|
|
Map projections
|
–Azimuthal
–Cylindrical –Conical |
|
|
Cartesian Coordinates
|
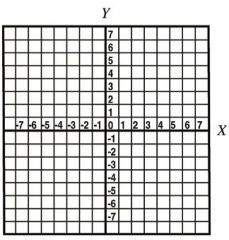
–2-dimensional (X, Y)
–Origin at (0,0) –Negative X values to the left of the Y axis –Negative Y values below the X axis |
|
|
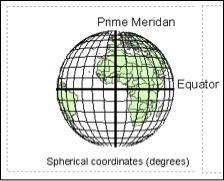
Geographic
|
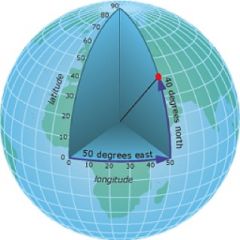
–Earth is approximately spherical
–Locations measured in degrees of latitude and longitude –DMS: 0°0’0” –Decimal: 0.0000° |
|
|
Latitude (lat)
|
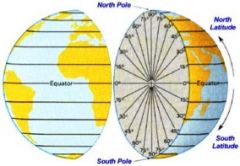
•Equator is 0° latitude
•Measure degrees north and south •Also called parallels •North Pole is 90°N (+) •South Pole is 90°S (-) •Tropics/Circles |
|
|
Longitude (long)
|
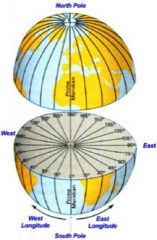
•Prime Meridian is 0°
•Measure degrees east and west •Known as meridians •All lines of longitude are “great circles” •180° E (+) or W (-) |
|
|
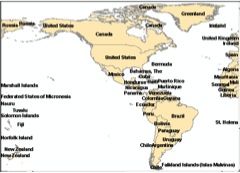
Hemispheres
|

|
|
|
Datums
|
Models of the Earth
|
|
|
Type of Datums
|
–Sphere
–Ellipsoid –Geoid |
|
|
Common US horizontal (2D) datums
|
North American Datum (NAD) 1927 or 1983
World Geodetic System of 1984 – U.S. DOD (used worldwide) |
|
|
Horizontal Datums
|
Ellipsoids
|
|
|
Ellipsoids
|
-Bulge at the equator
-Flattened at the poles -A theoretical surface which fits the Earth best (globally/regionally |
|
|
Vertical Datum
|
Geoid
|
|
|
Geoid
|
• The mean sea surface level
• Varies with the Earth’s gravity (larger when Earth’s crust is thicker) • A detailed 3D model of the surface |
|
|
Ellipsoid vs Geoid
|
• Ellipsoids are idealized (mathematical) models
• Geoids are more complex and representative (of the Earth surface) • Different ellipsoids work better in certain parts of the world |
|
|
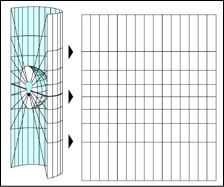
Map Projections
|
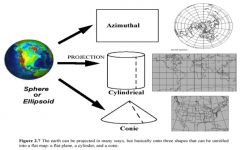
Projecting a 3D surface onto a 2D surface
|
|
|
Types of Projections
|
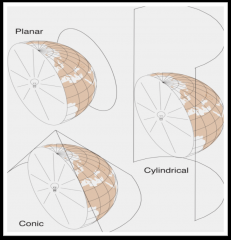
Planar (Azimuthal)
Cylindrical (Mercator) Conical |
|
|
Projection Properties
|
– Area: equal area or equivalent projection
– Shape: conformal – Direction: conformal, azimuthal – Distance: equidistant • Distortion (unavoidable) • The least distortion is along the tangent line (s) |
|
|
More Projections
|

|
|
|
Projected Coordinate Systems
|
• Once projected, data still needs coordinates
• Different systems depending on the scale and orientation of the map you’re trying to make • Most common are UTM (worldwide) and State Plane (for US) |
|
|
Universal Transverse Mercator
|
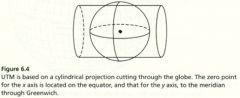
Based on a cylindrical projection cutting through the globe. The zero point for the x axis is located on the equator.
|
|
|
UTM Coordinate System
|
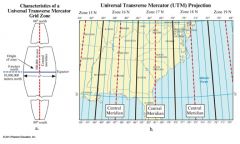
• Best for features with North-South orientation
• 60 zones, each of which is 6° of latitude wide • Origin at equator, 500,000 m west of the central meridian • Best for small scale maps |
|
|
State Plane Coordinate System
|
• Each state has one or more
• Usually one of two types: –Transverse Mercator •North-south states – Lambert Conformal Conic •East-west states |
|
|
Northing and Easting
|
• Origin far to the south and west
• Y values = northings • X values = eastings • Prevents negatives |
|
|
Mass. State Plane
|
NAD 1983 State Plane Massachusetts (m or ft.)
Projection: Lambert Conformal Conic Spheroid: GRS 80 |
|
|
Azimuthal/planar
|

|
|
|
Azimuthal/planar
|

|
|
|
Conic
|

|
|
|
Conic
|

|
|
|
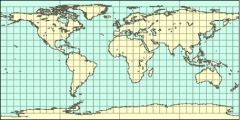
Cylindrical (Mercator)
|
|
|
|
Cylindrical (Mercator)
|

|
|
|
Unprojected (GCS)
|
– Geographic coordinate system
– Based on spherical coordinates – Degrees of latitude and longitude |
|
|
Projected
|
– Converts spherical coordinates to planar
– Set of mathematical equations – Projects 3D coordinates to 2D map |
|
|
Avoid GCS when mapping
|
-A map using a Geographic Coordinate system (GCS) appears distorted.
-Always use a projected coordinate system for mapping. |
|
|
Map Units
|
UTM (meters)
GCS (degrees) State Place (feet) |
|
|
Units Terminology
|
• Map units are determined by the data frame coordinate system.
• Display units can be set by the user, so that the coordinates may be viewed in any desired unit, such as miles. • Page units show the location on the map page layout, usually in inches or cm. |
|
|
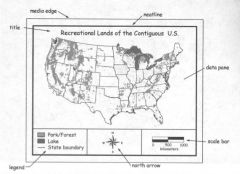
Map Basics
|
|
|
|
Thematic Map
|
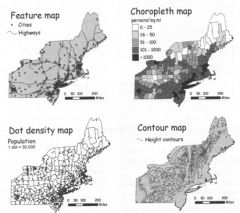
• Feature Map
• Choropleth • Dot Density • Isopleth/Contour |
|
|
Feature Map
|

|
|
|
Choropleth
|

|
|
|
Dot Density
|

|
|
|
Isopleth/Contour
|

|
|
|
Symbology Basics
|
• Symbols can indicate type or importance
• Can be based on nominal or numeric attributes |
|
|
Classification Methods
|
• Common:
– Manual – Equal Interval – Quantile – Natural Breaks |
|
|
Classification Methods
|
• Uncommon:
–Geometrical Interval –Standard Deviation |
|
|
Choosing Class Breaks
|
• For normally distributed data: Equal Interval
• Skewed data: Quantile or Natural Breaks • Most of the time, Manual may work better |
|
|
Symbolizing Class Breaks
|
Graduated Colors
Graduated Symbols Proportional Symbols Dot Density |
|
|
Data Collection Techniques
|
• Digitizing (tracing features)
–Scanned maps –Raster data • Surveying data points using GPS, surveying equipment • Remote sensing • Drawing files (CAD) |
|
|
Surveying
|
•The technique, profession, and science of accurately determining the terrestrial or three-dimensional position of spatial features
|
|
|
Surveying Tools
|
-Total Stations
-Theodolite -GPS |
|
|
Global Navigation Satellite Systems (GNSS)
|
• Global positioning system (GPS) is the first deployed set of GNSS for positioning. It was developed by DoD.
• Russia has been developing GLONASS • Galileo is planned by a consortium of European governments and industries • The fourth system is under development is the Chinese Compass Satellite Navigation System |
|
|
Global Positioning System
|
• system (constellation) of 24 satellites in high altitude orbits
• coded satellite signals that can be processed in a GPS receiver to compute position, velocity, and time |
|
|
Segments of GPS
|
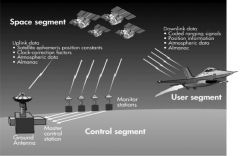
Control
Space User |
|
|
GPS Key Concepts
|
: using satellite ranging
: measuring distance from satellite : getting perfect timing : knowing where a satellite is in space : identifying errors |
|
|
Receiver Position is Based on Time
|
The Global Positioning System allows a GPS receiver to determine its position by using a simple formula: Velocity x Time = Distance
|
|
|
Measuring TIme
|
•Satellites have atomic clocks
– Very expensive: $100K •Receivers have “ordinary” clocks – Inexpensive and not as accurate as satellite’s clocks |
|
|
How many satellites are needed for positing?
|
Three can be enough but four is best and necessary because of clock errors associated with receivers
|
|
|
Sources of Errors When Positioning with GPS
|
• Tropospheric water vapor
• Multipath: reflected signals from surfaces near receiver • Noise: receiver noise • Satellite clock errors • Blunders: human error • Dilution of precision (DOP): satellite geometry • Ionosphere: electrically charged particles |
|
|
Differential GPS (DGPS)
|
Corrects errors at one location using measured errors at a known position (base station)
|
|
|
DGPS modes of measurement
|
• Real time
• Post-process |
|
|
"Heads-up” digitizing
|
Also known as on screen digitizing
|
|
|
Georeferencing
|
–The process of converting a map or an image from one coordinate system to another by using a set of control points and a transformation equation.
|
|
|
Editor Toolbar
|
Tools for creating and modifying features
|
|
|
Geocoding
|
Converting street address to x y coordinates
|
|
|
Rematching
|
Fixing the unmatched addresses
|
|
|
Space borne remote sensing
|
– CORONA
– IKONOS / Geoeye (high spatial res.) – Quickbird / WorldView (high spatial res.) – Landsat/ SPOT (medium spatial res.) – MODIS/VIIRS/AVHRR (low spatial res.) |
|
|
Airborne remote sensing (UAV)
|
– AVIRIS
– Predator – Global Hawk |
|
|
Concept or Resolution
|
Spatial
Spectral Temporal Radiometric |
|
|
Spectral Resolution
|
Panchromatic (one single band, e.g. CORONA, old aerial photographs, IKONOS/Quickbird Pan band)
Multispectral (several bands, e.g. Landsat, MODIS) Hyperspectral (many bands, e.g. AVIRIS) |
|
|
Spectral Resolution
|
Derived by the width and height of the resolution bands and the number of spectral bands
|
|
|
Airborne remote sensing
|
• Collected by cameras mounted on planes
• Multiple passes over a short time period • Orthorectified once images are joined • Perspective view |
|
|
LiDAR
|
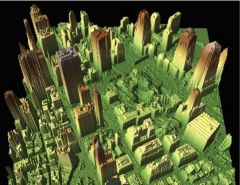
Light detection and Ranging - laser elevations
|
|
|
Topology
|
– The arrangement for how point, line, and polygon features share geometry
– Or knowledge about relative spatial positioning |
|
|
Query
|
A question posed to a database
|
|
|
Organizing attribute tables
|
• Flat Files
• Hierarchical • Relational (databases) • Object-oriented (database) |
|
|
Flat files
|
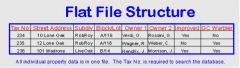
Spreadsheets
|
|
|
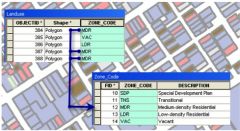
Relational
|
Various tables (databases) are linked through unique identifiers
|
|
|
Query Selection
|
– Select by Attribute: specify matching criteria
– Select by Location: based on spatial proximity |
|
|
SQL
|
Structured Query Language
|
|
|
One-to-one relationships
|
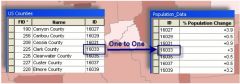
• each record in one table has only one matching record in another table
|
|
|
Many-to-one relationships
|
• multiple records in the table match to one record in another table
|
|
|
Relating tables
|
Used when tables have a one-to-many or many-to-many relationship
|
|
|
Steps of Georeferencing
|
– Coordinate transformation (scaling, rotating, skew)
– Resamping |
|
|
Coordinate Transformation Methods
|
– First-order polynomial (Affine)
– 2nd Order polynomial – 3rd order polynomial |
|
|
Vector Models
|
- Geo-relational Vector Model
- Object-based Vector Model |
|
|
Geo-relational Vector Model
|
- Arc Coverage (has topology) >>> format: binay
- Shape files (no topology) >>>> format: *.shp, *.shx, *dbf, etc |
|
|
Object-based Vector Model
|
Includes classes and geodatabases >>> format: *.mdb
|
|
|
Satellite Broadcast two types of data
|
Almanac data- not very precise
Ephemeris- by comparison very precise |
|
|
Remote sensing
|
Sensing/Taking measurements from a distance away from objects
|
|
|
Remote sensing data collection
|
– Optical/Thermal Cameras (e.g. Landsat)
– Laser (e.g. LiDAR) – Radar Transmitters/Receivers (e.g. SAR) |
|
|
Radiometric resolution
|
Tells us about the dynamic range of pixel numbers in an image
|
|
|
Shapefiles
|
• dbf = attribute table
• .prj = projection file • .shp = contains geometry information |