![]()
![]()
![]()
Use LEFT and RIGHT arrow keys to navigate between flashcards;
Use UP and DOWN arrow keys to flip the card;
H to show hint;
A reads text to speech;
43 Cards in this Set
- Front
- Back
|
Convex Slope |
Thick at top getting narrower |
|
|
Concave Slope |
Narrow at top getting thicker |
|
|
Uniform, Gentle Slope |
Even and thick space between contour lines |
|
|
Uniform, Steep Slope |
Even and thin space between contour lines |
|
|
Site |
Immediate area on which a settlement is found |
|
|
Physical features of a Landscape (site) include: |
- Contours: height, gradient of slope - Landforms: floodplain, valley swamps, etc. - Drainage: streams, lake, presence of swamps, etc. - Coastal features: river mouth, estuary, dunes, tidal flats, etc. - Vegetation: dense forest, native forest, bushes, etc. |
|
|
Situation |
The relative location of a settlement, in particular with the surrounding region. A description of a settlements situation would include direction, distance from other places, features, it's position along a road, railway and it's latitude and longitude |
|
|
Loss Burden |
The cost of mitigation and adaption of a hazard |
|
|
Proximity |
The distance from the occurrence/place of a hazard. (the closer the more vulnerable) |
|
|
Vulnerability |
The way a hazard or disaster will affect human life and property |
|
|
The Vulnerability and Proximity of Cyclone Yazi on Queensland |
|
|
|
The Vulnerability and Proximity of Ebola on West Africa |
|
|
|
Economic Damage |
losses of property, costs of repair or replacement, the past and future medical expenses, loss of past and future earnings. |
|
|
Economic Impact |
The effect of the hazard on the economy in a specified area, ranging from a single neighbourhood or the entire globe. Usually measures changes in business revenue, business profits, personal wages and or jobs |
|
|
Spatial Technology (Ecological Hazards) |
A Geographical Information System (GIS) is a computer system that: - captures, stores, checks, and displays data related to positions on the Earth's surface |
|
|
Spatial Technology (Natural Hazards) |
Satellites |
|
|
Spatial Technology (Natural Hazards and Ecological Hazards: Things in common) |
The collection of information and data or the processing of the data is used to develop understanding, planning and prediction of hazards. |
|
|
How does Spatial Technology help with risk management? (adaption and mitigation) |
|
|
|
Nature/causes (natural and human) and spatial patterns (location, scale, duration) of Natural Hazards |
|
|
|
Nature/causes (natural and human) and spatial patterns (location, scale, duration) of Ecological Hazards |
|
|
|
How LDC's and MDC's experience hazards (include; economic loss, social impact, and differences in vulnerability. Identify what is similar and what is different) |
|
|
|
Effect of a cyclone of |
MDC: |
|
|
Effect of Ebola |
LDC: |
|
|
Economic Impact: Natural Hazards (Economic: Cost of response to hazard, Cost of Rebuilding, cost of adaption for future hazards, Cost for individuals (medical costs, earnings property), Impact on the Economy) |
|
|
|
Social Impact: Natural Hazards (Social: Physical and Mental Health issues, Exposure to risks, Mitigation steps to help lessen vulnerability of people and property, management of land and environment, improving preparedness of community) |
|
|
|
Economic Impact: Ecological Hazards (Impact on Economy growth, Loss of Workers, Interruption of Production, Evacuation of Foreign Workers, Closing of Boarders, International transport closed, Foreign investment withdrawal) |
|
|
|
Social Impact: Ecological Hazards (Social: Breakdown of cohesion of community, mental health through loss of family/friends, Impact of children/survivors (stigma of Ebola, interruption to education/work), loss of leaders/important workers in community, ignorance and superstition (impending ability to respond to hazard), elevated fear, avoidance of medical treatment, violence against recovery teams. |
|
|
|
Natural Hazard: How does human activity intensify the impact of a hazard or the vulnerability people have to a hazard? |
|
|
|
Ecological Hazard: How does human activity intensify the impact of a hazard or the vulnerability people have to a hazard? |
|
|
|
Natural Hazards - Human Activity Specific examples of how human activity can intensify the impact of cyclones: |
- Urban Development: population density, infrastructure development, building regulations - Changing Topography: dam construction, altering the albedo effect - Climate Change: The greenhouse effect |
|
|
Examples to Include for vulnerability of Natural hazards |
-The ability to predict hazard occurring (early warning Systems
- Ability to protect people from hazards - Opportunity to avoid hazard through evacuation/shelter - Training and education of population - Demographic factors such as age - Provision of rescue and relief services - Quality of Built Features (transport, infrastructure, housing, power) - Proximity to the hazard - Population density |
|
|
Human impact on the vulnerability of ecological hazards for some places |
- Population growth and distribution - Increased population and density - Increased Urbanisation - Numbers of vulnerable people (elderly, children) - Poverty - Levels of education |
|
|
Are risk management strategies sustainable and effective in MDC's (examine whether you think MDC's could effectively implement the plan in the long term in relation to factors such as: - Skilled worker level - Management Systems - Regulation enforcement - Technology -Emergency planning and responses |
|
|
|
Eastings |
the numbers that run along the top or bottom of a map increasing in value from west to east |
|
|
Northings |
the numbers that run along the right or left sides of a map increasing in value from south to north. |
|
|
Saddle |
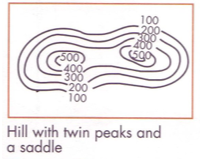
Dips Between Mountains |
|
|
Hill |
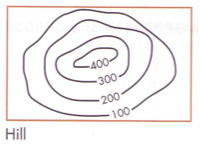
The high points of the mountain |
|
|
Ridge |
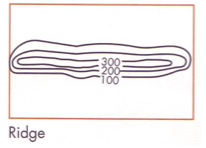
A low narrow hilltop or mountain range |
|
|
Spur |
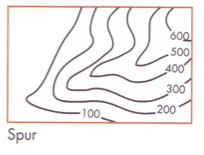
a tongue of land descending from a hill |
|
|
Cultural Features |
Features Made by Man |
|
|
Natural Features |
Features from Nature |
|
|
7 Continents of the World |
- North America - South America - Europe - Africa - Asia - Autralia - Antarctica |
|
|
Spatial Patterns |
Areal distribution and variation in density of geographical data. |