![]()
![]()
![]()
Use LEFT and RIGHT arrow keys to navigate between flashcards;
Use UP and DOWN arrow keys to flip the card;
H to show hint;
A reads text to speech;
4 Cards in this Set
- Front
- Back
|
Maps should have a:
title scale north arrow key or legend |
Layer shadingMaps are sometimes shaded to show the height of land.
|
|
|
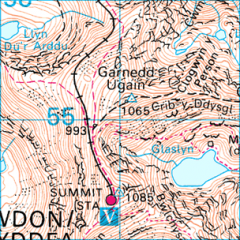
This map extract shows exact heights by a black dot with a number next to it. The number is the height above sea level in metres. The blue triangle represents a triangulation pillar; the networks of concrete pillars found in the UK that were used to make maps.
|
|
|
|
Contours
These are lines drawn on maps that join places of the same height. They are usually an orange or brown colour. Some contour lines have their height above or below sea level written on them. It is possible to use them to see the shape of the land - if contour lines are close together the slope is steep, if they are far apart the slope is gentle. Contour lines are usually drawn at 10 metre intervals on a 1:50,000 scale map and at 5 metre intervals on a 1:25,000 scale map. |

|
|
|
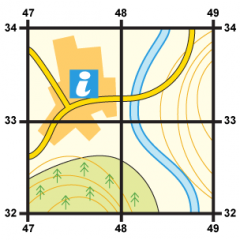
Start at the left-hand side of the map and go east until you get to the easting crossing through the bottom-left-hand corner of the square you want. Write this number down.Move north until you get to the northing crossing the bottom-left-hand corner of the square you want. Look at the number of this grid line and add it to the two-digit number you already have. This is your four-figure grid reference.In this case, the tourist information office is in grid square 4733.
|
|