![]()
![]()
![]()
Use LEFT and RIGHT arrow keys to navigate between flashcards;
Use UP and DOWN arrow keys to flip the card;
H to show hint;
A reads text to speech;
31 Cards in this Set
- Front
- Back
- 3rd side (hint)
|
What is profitability ? |
Indicates the effectiveness of an enterprise in utilising its capital to generate income RF: HOW EFFECTIVE THE BUSINESS IS IN USING ITS CAPITAL TO MAKE INCOME |
What does profitability indicate about a business ? |
|
|
What are the profitability ratios |
Return on Total Assets Return on Equity Cost of Debt(Return on Debt Capital) Return on financial assets |
Returns |
|
|
Different types of ratios |
1. Profitability 2. Profit Margins 3. Liquidity 4. Turnover Ratios and Times 5. Solvency 6. Coverage 7. Investment |
|
|
|
Different profit margins |
1.Gross profit margin 2. Operating profit margin 3. EBIT-margin 4. Net profit margin |
|
|
|
Different Liquidity ratios |
1. Current ratio 2. Acid test ratio |
|
|
|
Turnover ratios and times. Answer must be like.. xxx ratio and time of xxx |
1. Turnover ratio and time of CURRENT ASSETS 2. Turnover ratio and time of PPE 3. Turnover ratio and time of TRADE RECEIVABLES 4. Turnover ratio and time of INVENTORY |
|
|
|
Solvency |
Debt-to-assets ratio(debt ratio) |
|
|
|
Coverage Ratios |
1. Finance cost coverage 2. Ordinary dividend coverage |
|
|
|
Investment Ratios |
1. Earnings per share 2. Earnings Yield 3. Dividend per share 4. Dividend yield 5. Price-earnings ratio 6. Book value per share |
|
|
|
Calculate return on total assets |
(Operating profit + Investment income) / Average total assets X 100 |
|
|
|
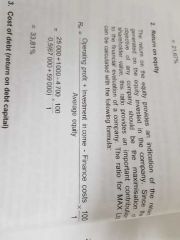
Cal. Return on equity |
|
|
|
|
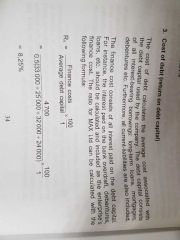
Cal. Cost of debt aka Return on debt captial |
|
|
|
|
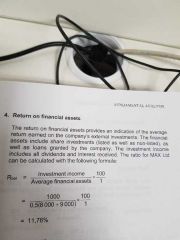
Return on financial assets |
|
|
|
|
Gross profit margin |
Gross profit/revenue X 100 |
|
|
|
Cal. Operating profit margin |
Operating profit/revenue X100 |
|
|
|
EBIT-margin |
(Profit before tax+finance costs)/Revenue X100 |
|
|
|
Cal. Net profit margin |
Profit AFTER tax/revenue X100 |
|
|
|
What is Liquidity |
- An Enterprises abilityym to meet its short-term liabilities - if Liquidity is insufficient. It may lead to solvency problems |
|
|
|
Cal. Current ratio |
Current assest/current liabilities |
|
|
|
Acid test ratio |
(Current assets - inventory - prepayments)/ current liabilities |
|
|
|
Turnover ratio and times of current assets |
Ratio: Net revenue/ Average current assets Time: average current assets/ net revenue x360 for days |
|
|
|
Turnover ratio and time of ppe |
Ratio: Net revenue/ Average ppe @ carrying value
Time: average ppe @ carrying value/ney revenue X 360 |
|
|
|
Turnover ratio and time of TRADE RECEIVABLES |
Ratio: Credit revenue/ average trade receivables
Time: average trade receivables/ credit revenue X360 |
|
|
|
Turnover ratio and time of inventory |
Ratio:Cost of sales/ Average inventory
Time: average inventory/ cost of sales X360 |
|
|
|
Debt-to-assets ratio and the alternative one |
Debt capital/TOTAL assets X100 Debt capital/TOTAL capital X100 |
|
|
|
Finance cost coverage |
Profit BEFORE finance cost and tax / Finance costs |
|
|
|
3 different ordinary dividend coverage ratios |
Dividend cover : 1. Earnings per share/Dividend per share 2. Profit AFTER tax - PS dividends / Ordinary dividends declared 3. Earnings Yield/ Dividend yield |
|
|
|
Earnings per share |
Attributable earnings/ average number of ordinary shares issued |
|
|
|
Earnings Yield |
Earnings per share/ market price per share X100 |
|
|
|
Dividend per share |
Ordinary dividend declared/ averaged number of ordinary shares issued |
|
|
|
Dividend Yield |
Dividend per share/Market price per share X 100 |
|