![]()
![]()
![]()
Use LEFT and RIGHT arrow keys to navigate between flashcards;
Use UP and DOWN arrow keys to flip the card;
H to show hint;
A reads text to speech;
39 Cards in this Set
- Front
- Back
|
Profitability & Return ratios |
1) PBIT 2) PBT 3) ROCE 4) ROE 5) secondary- Profit Margin 6) secondary- Asset Turnover |
|
|
Debt & gearing/leverage ratios |
1) Debt ratio 2) Gearing 3) Leverage 4) Interest cover |
|
|
Liquidity & working capital ratios |
A) Liquidity ratios 1) Current ratio 2) Quick ratio B) Efficiency ratios 1) Receivable Collection Period 2) Inventory Turnover Period 3) Payable Payment Period 4) Operating cycle |
|
|
Shareholders’ investment ratio |
1) Eps 2) Dps- dividend per share 3) Dc - dividend cover 4) P/E ratio - price/ earning ratio 5) DY- dividend yield |
|
|
PBT- profit before tax |
Better fig to use than profit after tax, because there might be unusual variations in the tax charge from year to year which would not affect the underlying profitability of the company’s operation |
|
|
Pbit- profit before interest and tax |
Amount of profit which the company earned before having to pay interest to the providers of loan capital (long term loan capital) |
|
|
ROCE- Return on capital employed |
ROCE= (pbit/capital employed) x 100% Cap employed = s/holders’ equity + LT liabilities (or tot assets-CL) - to assess profits growth, need to relate to amount of funds (capital) that were employed in making the profits. - measure overall efficiency of a company in employing the resources available to it |
|
|
ROE- Return on equity |
ROE- PAT &preference div/ equity s/holders funds |
|
|
Profit Margin |
PM = PBIT/Sales - make a high or low profit margin on its sales |
|
|
Secondary ratio |
Profit margin x asset turnover = ROCE - we often sub analyse ROCE to find out why ROCE is high or low, or better or worse than last year. Two factors contribute in ROCE |
|
|
Asset turnover |
AT = sales/ capital employed is a measure of how well the assets are being used to generate sales |
|
|
Relationships btw profit margin & Asset turnover |
There is trade off btw them cannot look at one 1) usually high profit margin= good (profit) - means high profit per $1 of sales, but this also means sales price are high, possibility sales turnover will be depressed n so asset turnover lower 2) high asset turnover- good (volume) - means that company is generating a lot of sales, but to do this it might have to keep its price down n accept a low profit margin per $1 of sales |
|
|
Interest cover |
IC = PBIT/ interest charges - shows whether comp is earning enough PBIT to pay its interest costs - fall in PBIT, would have significant effect on profits available for s/holders. Even small change in PBIT |
|
|
Debt ratio |
DR- total debts/ total assets 50% safe limit. |
|
|
Gearing |
G = (Total LT debt/ sholders’ equity + tot LT debt) x 100% - concerned with comp LT capital structure - company consists of nca & ca, these assets must be financed by LT capital G more than 50% = high G |
|
|
To lower gearing by |
Boosting it sholders’ capital by - REtained profits - new share issue |
|
|
Leverage |
L = (sholders’ equity/ sholders’ equity + tot LT debt) x 100% Or = (sholders’ equity/ tot asset- CL) x 100% - converse of gearing total assets financed by equity - equity to asset ratio - leverage is to mirror image of gearing |
|
|
Current ratio |
CR = CA/CL : CR should be more than 1 - comp should have enough current assets, to meet its future commitments to pay off its current liabilities |
|
|
Quick ratio |
QR = (CA- Inventory)/ CL Comp with slow turnover = QR more than 1 Comp with fast turnover= its ok to less than 1(0.8) - comp not able to convert all their CA into cash very quickly - some manufacturing comp might hold large quantities of raw material, stocks, to produce finished goods. - where inventory turnover is slow , most inventories are not liquid assets, because cash cycle is long |
|
|
Receivables Collection Period |
RCP= (TR/credit sales) x 365 days - Avg length time takes for customer to pay what they owe Measure the efficiency: - by comparing trend of collection period over time - diff in collection period, reflects diff btw types of business |
|
|
Inventory Turnover period |
ITP= (inventory/cost of sales) x 365 days -avg no. Of days that items of inventory are held for - measure of how vigorously a business is trading |
|
|
Lengthening Inventory level indicates |
1) slow down in trading 2) build up in inventory level But get bulk buying discount |
|
|
Payable payment period |
PPP= (TP/ Purchases) x 365 days - help to assess company’s liquidity - increase means sign of lack of LT finance or poor management of Current Asset - result in use extended credit from suppliers, increased bank overdraft |
|
|
Receivables Collection Period (RCP) + Inventory turnover period (ITP) |
- give indication of how soon inventory is converted into cash- liquidity |
|
|
Operating cycle |
OC = ITP + RCP - PPP = Inventory Turnover Period + Receivables Collection Period - Payables Payment Period •is the average period of time required for a business to make an initial outlay of cash to produce goods, sell the goods, and receive cash from customers in exchange for the goods. |
|
|
Cash cycle effect by 3 factors: |
1) PPP 2) ITP 3) RCP |
|
|
Liquidity |
- is the amount of cash a company can quickly settle it debts & possibly to meet unforeseen demands for cash payments too. |
|
|
Earning per share |
1) EPS - return on each ordinary share of the year |
|
|
Dividend cover |
• DC = EPS/ Div per share - shows proportion of profit for the year is available for distribution to sholders and proportion will be retained in business to finance future growth. |
|
|
P/E ratio- price earning ratio |
P/E ratio= price per share/ EPS - high p/e indicate strong sholder confidence |
|
|
Dividend yield |
DY= (div per share/ current MVof ex div share) x 100% Dps - is taken as previous yr div Ex div- share price not include right to the most recent div |
|
|
Diluted EPS |
-is a calculation used to gauge the quality of a company's earnings per share (EPS) if all convertible securities were exercised. -Convertible securities are all outstanding convertible preferred shares, convertible debentures, stock options, and warrants. -Unless a company has no additional potential shares outstanding (rare), the diluted EPS will always be lower than the simple or basic EPS. -Diluted EPS considers what would happen if dilutive securities were exercised. -Dilutive securities are securities that are not common stock but can be converted to common stock if the holder exercises that option. -If converted, dilutive securities effectively increase the weighted number of shares outstanding, which decreases EPS.
Read more: Diluted Earnings Per Share - Diluted EPS https://www.investopedia.com/terms/d/dilutedeps.asp#ixzz5XdSH7ssh Follow us: Investopedia on Facebook
|
|
|
Effect on EPS of changes in capital structure |
1) earnings per share with a new issue -weighted avg no. of shares* • existing share 8M, issue new 1 M on 30.09.X2 01.01.x2- 30.09.x2 (9mth) : 8 M x 9/12 = 6,000,000 9 M x 3/12. = 2,250,000 Total = 8,250,000 2) earnings per share with a bonus issue - number of shares* - restated eps* • existing 400,000, new bonus issue 100,000 on 30.09.X2 Old 01.01.X2- 30.09.X2 (9mth) : 400,000 New 30.09.X2- 31.12.X2 (3mth) : 100,000 Total = 500,000 shares - restated EPS (for prior year, eps= 18.75c) 18.75c x 400/500 = 15c* 3) earnings per share with a rights issue - theoretical ex-rights price(terp)* - weighted avg no. of shares* - restated eps* • existing 100,000, 1 for 5 rights issue on 01.10.X2 at price $1. Last day price $1.60 -terp: 5 x $1.60 = $8 1 x $1. = $1 Terp of 6 shares =$9/6 = $1.50 - restated eps EPS = 40c x 1.5/1.6 = 37.5c* - no. Of shares 01.01.x2- 01.10.x2 (9mth). 100,000 x 9/12 x 1.6/1.5=80,000 120,000 x 3/12 = 30,000 Total = 110,000 Eps = $50,000/110,000 = 45.5c |
|
|
Dilutive loan stock |
When incremental eps for loan stock not higher than basic eps |
|
|
Convertible loan note ( effect on Eps) |
Example: 5,000,000 ordinary shares of 25c , tot earning $1,750,000 (eps1.75M/5M=35c) 2,000,000 of 10% convertible loan stock, convertible in 3 yrs time Income tax rate 35% •new share - rate of 3 shares per $5 of stock $2,000,000 x 3/$5 = 1.2M shares • Interest saved (10% x 2M) x (100%- 35%) = 200,000 x 0.65 = $130,000 • effect on eps Interest saved/ shares = $130,000/ 1.2M = 10.8c = 10% loan stock is dilutive • dilute eps (1.75m+0.13m)/ (5m+1.2m). = 30.3c |
|
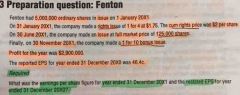
Example Eps |
Back (Definition) |
|
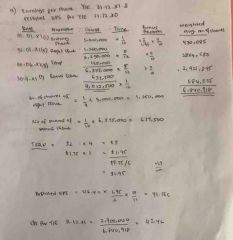
Eps for non exercise shares |
Back (Definition) |
|
|
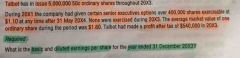
Ratios example |
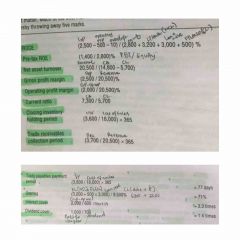
Back (Definition) |
|
|
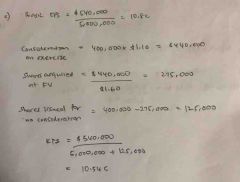
Ratios example |
Back (Definition) |