Reading...
![]()
Play button
![]()
Play button
![]()
Use LEFT and RIGHT arrow keys to navigate between flashcards;
Use UP and DOWN arrow keys to flip the card;
H to show hint;
A reads text to speech;
9 Cards in this Set
- Front
- Back
|
The term Market Failure refers to
|
a market that fails to allocate resources efficiently
|
|
|
What does an externality result in?
|
an equilibrium that does not maximize the total benefits to society
|
|
|
Why is Dioxin emission that results from the production of paper a good example of a negative externality?
|
self-interested paper producers will not consider the full cost of the dioxin pollution they
create |
|
|
If an aluminum manufacturer does not bear the entire cost of the smoke it emits, it will
|
emit a higher level of smoke than is socially efficient
|
|
|
What does research into new technologies provide?
|
positive externality, and too few resources are devoted to research as a result
|
|
|
If a sawmill creates too much noise for local residents,
|
the government can raise economic well-being through noise-control regulations
|
|
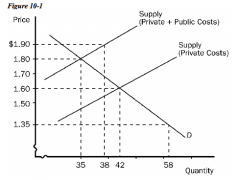
This graph represents the tobacco industry. Without any government intervention, the equilibrium price and quantity are
|
$1.60 and 42 units, respectively
|
|
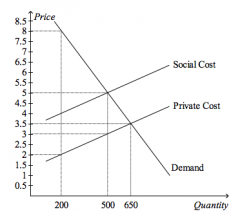
Suppose that the production of plastic creates a social cost which is depicted in the graph above. What is the socially optimal quantity of plastic?
|
500 units
|
|
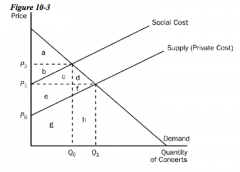
The difference between the social cost curve and the supply curve reflects the
|
cost of spillover effects from the concert (e.g., noise and traffic)
|