Reading...
![]()
Play button
![]()
Play button
![]()
Use LEFT and RIGHT arrow keys to navigate between flashcards;
Use UP and DOWN arrow keys to flip the card;
H to show hint;
A reads text to speech;
38 Cards in this Set
- Front
- Back
|
Is retrospectively looking at death certificates to identify causes of mortality a good survival analysis?
|
No, in fact it is a selection bias.
|
|
|
What is the most appropriate method for doing survival analysis?
|
Follow a predefined cohort prospectively and measure the time to death.
|
|
|
What data must be censored in a survival analysis?
|
After a time interval in the study, those who have died or have withdrawn from the study should not be included as part of the total population in subsequent time intervals.
|
|
|
What is the preferred graph for a survival analysis curve?
|
Kaplan-Meier curve
|
|
|
What are three basic rules about Kaplan-Meier curves?
|
1. Always note withdrawals from the study.
2. Don't change the graph until there is a death and calculate a new survival percentage at that time. 3. At any time point, the Y-axis reports the cumulative probability of survival. |
|
|
When constructing a Kaplan-Meier curve, what needs to be done with the second interval?
|
Since the Y-axis reports the cumulative survival probability, the second interval survival probability must be multiplied by the first interval survival probability.
|
|
|
Why do survival curves become less accurate as you move to the right?
|
Because the number of people being followed is decreasing.
|
|
|
How do you setup a two by two table?
|
Test (+ or -) vs. Truth (+ or -)
|
|
|
What is the sensitivity of a test defined as?
|
The probability of having a positive test if you have the disease. a/(a+c)
|
|
|
What is the specificity of a test.
|
The probability of having a negative test if you don't have the disease. d/(b+d)
|
|
|
Why is positive predictive value not the same as sensitivity?
|
Because it takes the prevalence of the disease into account.
|
|
|
How is positive predictive value calculated?
|
True positives divided by all positive tests.
|
|
|
How do you calculate the negative predictive value?
|
True negatives divided by all negative results.
|
|
|
What can a case-control table be used to calculate and what can it not be used to calculate? Why?
|
Can calculate sensitivity and specificity, but not PPV nor NPV. Because the prevalence of the disease is required.
|
|
|
If given a case-control study and a prevalence of the disease, what do you need to do to the table to be able to calculate the NPV and PPV?
|
Adjust the table to reflect a population of 1000 people by proportionally increasing the numbers in the b and d cells.
|
|
|
What is positive likelihood ratio (LR+)?
|
sensitivity/(1-specificity)
|
|
|
What is a negative likelihood ratio (LR-)?
|
(1-sensitivity)/specificity
|
|
|
If an LR+ is 12, what does this mean?
|
If I have a positive result, I am 12 x more likely to have the disease than to not.
|
|
|
If an LR- is 0.05, what does it mean?
|
If I have a negative test, I am 1/0.05 or 20 x less likely to have the disease.
|
|
|
What are the mnemonics for using specificity and sensitivity?
|
SpIN: A test with a high specificity can rule in a disease.
SnOUT: A test with a high sensitivity can rule out a disease. |
|
|
What is the benefit to serial testing?
|
If any test is negative, stop testing. It increases specificity, but lowers sensitivity beyond each individual test.
|
|
|
What is the benefit to parallel testing?
|
If any test is positive, diagnosis is made. It increases sensitivity, but lowers specificity beyond each individual test.
|
|
|
When should you screen for a disease?
|
When it is common, serious, treatable, slow to develop symptoms, and treatable when asymptomatic.
|
|
|
What is the best properties of a screening test?
|
High predictive values, inexpensive, something the patient and physician are willing to perform.
|
|
|
What is lead time bias?
|
When you use a screening test to identify a disease before symptoms appear, it gives the false impression that the patient lives longer. Rather, this is just due to earlier diagnosis.
|
|
|
What is length time bias?
|
Diseases progress at different rates, therefore screening tests may identify patients who slowly progress to the disease, giving a false sense of prolonged survival for these patients.
|
|
|
What is volunteer bias.
|
Patients who volunteer for screening tests tend to be healthier and take better care of themselves.
|
|
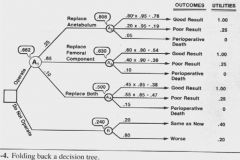
What do all of the symbols and numbers represent?
|
Boxes are decision nodes
Circles are chance nodes Ovals are end nodes Numbers along branches are probabilities Quotes are the weighted utilities |
|
|
What is sensitivity analysis with respect to decision trees.
|
The effect of changing utilities on the overall decision recommendation.
|
|
|
What is the potential danger of running multiple tests on a patient?
|
You are more likely to identify an abnormal finding.
|
|
|
What allows you to increase the likelihood ratio that a test will have a correct and useful result?
|
Have a clinical indication to order a test and reduce the number of unnecessary tests.
|
|
|
Every time you look in on clinical trial results, it is like performing another test and this increases your probability of finding a result purely based on chance. What is this phenomenon called?
|
alpha-consumption
|
|
|
What is the formula for relative risk?
|
RR = Ie/Io (risk/risk)
|
|
|
What is the formula for attributable risk?
|
AR = Ie - Io (risk - risk)
|
|
|
What is the formula for attributable risk %?
|
AR% = (Ie - Io)/Ie = (RR - 1)/RR
|
|
|
What is the formula for population attributable risk?
|
PAR = Pe(AR)
|
|
|
What is the formula for population attributable risk %?
|
PAR = (Pe(RR - 1))/((Pe(RR - 1) + 1)
|
|
|
What is a major difference between cohort studies and case-control studies?
|
Case-control studies cannot calculate incidence or AR/PAR but can calculate AR% and PAR%.
|