Reading...
![]()
Play button
![]()
Play button
![]()
Use LEFT and RIGHT arrow keys to navigate between flashcards;
Use UP and DOWN arrow keys to flip the card;
H to show hint;
A reads text to speech;
34 Cards in this Set
- Front
- Back
|
How many btu of energy supply "flowed" through the US in 2009?
|
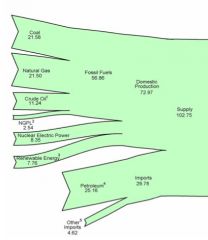
102.75 quadrillion btu
Source: EIA |
|
|
What percentage of domestic energy supply comes from coal, gas, crude, ngpl, nuclear and renewables and what are these sources as a percent of total energy supply?
|

|
|
|
How much energy is consumed and what percentage is consumed in each of residential, commercial, industrial and transportation?
|
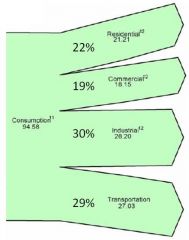
(Quadrillion btu)
|
|
|
Name 3 states in a US coal supply region
|

Source: EIA Annual Energy Outlook 2011
|
|
|
What is the approx btu content of average coal produced in US?
|
19,933 btu / short ton
|
|
|
What is the approx btu content of average coal imported into the US?
|
24,786 btu / short ton
|
|
|
What is the approx btu content of average coal exported from the US?
|
25,550 btu / short ton
|
|
|
What is the average btu content of domestic and imported crude oil
|
5,800 btu / bbl (domestic)
5,989 btu / bbl (imported) |
|
|
What is the average btu content of motor gasoline?
|
5,119 btu / bbl
|
|
|
What is the average btu content of natural gas liquids?
|
3,692 btu / bbl
|
|
|
What is the average btu content of dry gas?
|
1,026 btu / cubic ft
|
|
|
What is the average btu of electricity consumption?
|
3,412 btu / kwh
|
|
|
What is the low and high historical price ratio for crude over gas?
|
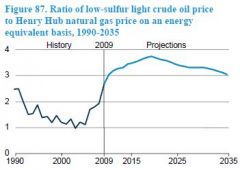
Source: EIA Annual Energy Outlook 2011
|
|
|
What was total domestic gas production in 2009?
What percent was from shale gas? What might be total production in 2035? What percent might shale gas represent? |
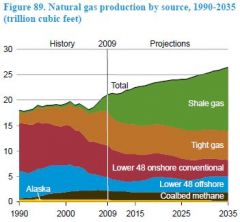
Total production: ~22 Tcf (~61 bcf/d)
Shale gas: 16% Total production 2035: 26 Tcf (~72 bcf/d) Shale gas: 47% Source: EIA Energy Outlook 2011 |
|
|
How much nuclear capacity was installed in the US in 2009?
|
101 GW
|
|
|
Where would one look for historical charts on US energy data?
|
EIA Annual Energy Review
http://www.eia.doe.gov/emeu/aer/ |
|
|
What was the net generation in 2009 and from what sources (in percent)?
|
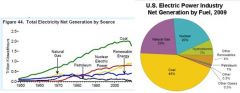
4.1 trillion kWhs
45% coal; 23% gas; 20% nuclear; 11% renewable (mostly hydro); 1% petroleum Source: EIA Annual Energy Review 2009 |
|
|
How much retail electricity was sold/consumed in 2009?
What percent to each of residential, commercial and industrial? |
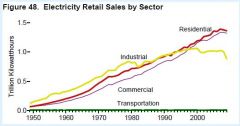
~3.7 trillion kWhs
38% (Residential) 37% (Commercial) 25% (Industrial) |
|
|
What was the US, China and India's petroleum consumption in 2009?
|
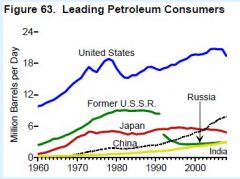
~18 MMBbl/day (US);
~8 MMBbl/day (China); ~2 MMBbl/day (India) Source: EIA Annual Review 2009 |
|
|
Approximately how much domestic crude was produced in 2009 and from where?
|
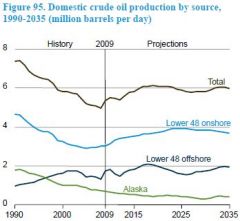
~5.25 MMbbl/day (total)
~3 MMbbl/day onshore ~2 MMbbl/day offshore <1 MMbbl/day Alaska Source: EIA Annual Review 2009 |
|
|
What was the US, China and India's petroleum consumption in 2009?
|
~18 MMBbl/day (US); ~8 MMBbl/day (China); ~2 MMBbl/day (India)
Source: EIA Annual Review 2009 |
|
|
In what year did US per capita energy consumption peak?
At what level? What was it in 2009? |
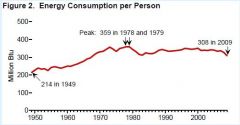
Peak: 1978-79
Peak level: 359 MMBtu / person 2009 level: 308 MMBtu / person Source: EIA Annual Review 2009 |
|
|
What percent of gas consumption was consumed by the Industrial, Electric Power, Residential and Commercial sectors in 2009?
|
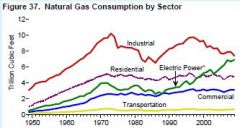
Industrial: 32%
Power: 30% Residential: 20% Commercial: 13% |
|
|
Who were the top 4 crude producers in 2009?
|

Source: EIA Annual Energy Review 2009
|
|
|
How much net summer installed capacity existed in 2009 and what were the 3 largest components?
|
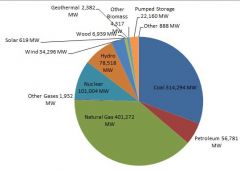
1,025,400 MW (1.025 TW)
Natural Gas - 401 GW (39%) Coal - 314 GW (31%) Nuclear - 101 GW (10%) |
|
|
What were the 2009 capacity factors for coal, nuclear, natural gas and all sources?
|
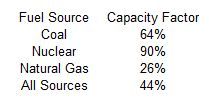
Source: EIA
|
|
|
How much coal to gas switching has occurred in 2009 - 2011?
|
2009: 3.0 bcf/d
2010: 2.5 bcf/d 2011: 2.8 bcf/d (forecasted) Source: Tudor Pickering Holt & Co |
|
|
What is the maximum amount of coal to gas switching that can theoretically occur?
|
Max theoretical amount: 12 bcf/d
Source: Tudor Pickering Holt & Co |
|
|
At what gas price does coal to gas switching occur?
|
at $4.3/mmbtu vs $75/ton eastern coal price (17.4x spread)
Source: Tudor Pickering Holt & Co |
|
|
What is historical max gas - coal price spread ($/MWh) and what is it now?
|
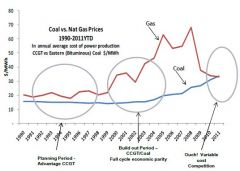
Max: ~$40/MWh in 2H 2008
Now: ~$0 Source: Tudor Pickering Holt & Co |
|
|
What is approximate variable cost of the marginal bituminous coal plant?
What is the approximate variable cost of the marginal CCGT plant (at $4.30/mmbtu)? |

Coal: $60-$65/MWh
CCGT: $50-$55/MWh Source: Tudor Pickering Holt & Co |
|
|
What percentage of gas + coal generation is gas fired?
What type of gas plant is the largest portion of the gas fleet? How much (bcf/d and %) gas is consumed by this fleet? |

Percentage: 34%
Type: CCGT Gas Consumed: 16.2 bcf/d or 25% Source: Tudor Pickering Holt & Co |
|
|
What portion of gas + coal generation is produced from coal?
What is the largest portion (in type of coal burned) of the coal fleet? |

65% coal
Bituminous (33% of gas + coal gen) Source: Tudor Pickering Holt & Co |
|
|
Reference only - no quiz
Note the different gas-coal breakeven data points |
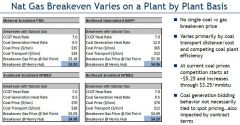
Source: Tudor Pickering Holt & Co
|