Reading...
![]()
Play button
![]()
Play button
![]()
Use LEFT and RIGHT arrow keys to navigate between flashcards;
Use UP and DOWN arrow keys to flip the card;
H to show hint;
A reads text to speech;
24 Cards in this Set
- Front
- Back
|
Statistics
|
A set of tools and techniques used to organize and interpret information
|
|
|
Variability
|
The amount of spread or dispersion in a set of scores
|
|
|
Descriptive Statistics
|
Values that describe the characteristics of a sample population
|
|
|
Inferential Statistics
|
Tools that are used to infer the results based on a sample to a population
|
|
|
Data
|
A record of an observation or an event such as a test score, a grade in math class, or response time
|
|
|
Data point
|
An observation
|
|
|
Data set
|
A set of data points
|
|
|
Mean
|
A type of average where scores are summed and divided by the number of observations
|
|
|
Mean deviation
|
The average deviations for all scores from the mean of a distribution
|
|
|
Measures of central tendency
|
The mean, median and mode
|
|
|
Median
|
The point at which 50% of the cases in the distribution fall below and 50% fall above
|
|
|
Mode
|
Most frequently occurring score in a distribution
|
|
|
Standard Deviation
|
The average deviation from the mean
|
|
|
Mean Deviation
|
The average deviation for all scores from the mean of a distribution
|
|
|
Unbiased Estimate
|
A conservative estimate of a population parameter
|
|
|
Frequency Distribution
|
A method for illustrating the distribution of scores within class intervals
|
|
|
Class Intervals
|
The upper and lower boundary of set of scores used in the creation of a frequency distribution
|
|
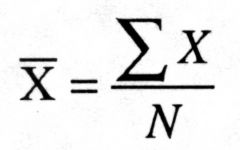
What is this formula used for?
|
Finding the Mean
|
|
|
Mean vs. Median
|
Mean
Extreme scores can skew the value of the mean Simpler to calculate, particularly with larger datasets Median Extreme scores have less effect on median value Social and economic indicators are typically reported using median since income can have extreme values that would skew the mean |
|
|
Mean vs. Median vs. Mode
|
Use the Mode:
When the data are qualitative, categorical, or nominal (political affiliation, eye color, etc.) Use the Median: When you have quantitative data (score, age, etc.) with extreme scores Use the Mean: When you have quantitative data (score, age, etc.) and can benefit from more precision |
|
|
What is the formula for the Range?
|
r = h - l
|
|
|
Range
|
Most general estimate of variability
How far apart scores are from one another |
|
|
How do you find the Standard deviation?
|
1.Data set
5, 8, 5, 4, 6, 7, 8, 8, 3, 6 2.Calculate the mean Mean = 60/10 = 6 3.Find difference between each score and the mean Differences = -1, +2, -1, -2, 0, +1, +2, +2, -3, 0 4.Square each difference and then find the sum Squared differences = 1, 4, 1, 4, 0, 1, 4, 4, 9, 0, sum = 28 5.Divide sum by n - 1 and take the square root 28/9 = 3.11, square root of 3.11 = 1.76 Standard deviation = 1.76 Each score differs from the mean of the distribution by an average of 1.76 points |
|
|
Variance
|
Variance (s2) is the standard deviation squared
s2 = s x s |