![]()
![]()
![]()
Use LEFT and RIGHT arrow keys to navigate between flashcards;
Use UP and DOWN arrow keys to flip the card;
H to show hint;
A reads text to speech;
276 Cards in this Set
- Front
- Back
|
Opportunity cost |
What must be given up in order to undertake any activity or economic exchange |
|
|
How can economic growth be illustrated? |
Outward shift of a nation's PPC |
|
|
Law of Demand |
As price of a good increases, its quantity demanded decreases and vice versa |
|
|
Shift in demand vs. movement along a demand curve |
A change in price causes a change in quantity demanded, with the corresponding movement along the curve.
An increase or decrease in demand causes a shift in the demand curve, causing an increase or decrease in the quantity demanded at each price |
|
|
Supply |
Quantity of a good or service that producers are willing to offer for sale at a given price during a specific time period |
|
|
Law of Supply |
As price increases, more of a good is offered for sale by firms (in order to maximise profits) |
|
|
Supply substitute |
A good that can be produced in a similar way, with similar inputs and processes as another good |
|
|
Excess capacity |
The amount of output an industry can produce in the short run beyond its current level without having having to expand its plant size |
|
|
Specific tax |
A set amount charged per unit of the product sold |
|
|
Ad valorem tax |
A percentage tax on a good or a range of goods |
|
|
Tradable permit scheme |
A system for taxing pollution levels where pollution levels are exchangeable between firms on a secondary market |
|
|
3 methods of counting national income |
1. Income approach 2. Output approach 3. Spending (expenditure) approach |
|
|
Nominal vs Real GDP |
Nominal = value, in current prices, of all final goods and services produced in a country within a given time period
Real = value, in constant prices, of all final goods and services produced in a country within a given time period, usually measured against prices of predetermined base year |
|
|
Supply-Side Policies |
A combination of government-led and free market policies designed to increase the productive capacity of the country |
|
|
3 Factors that explain the negative causal relationship between price and quantity demanded |
- INCOME effect: As prices decrease, quantity demanded increases because consumers have more buying power and real income to spend
- SUBSTITUTION effect: As prices decrease, consumers switch from other substitute goods to the good with a comparatively lower price
- LAW OF DIMINISHING MARGINAL UTILITY: With the consumption of each additional units, the satisfaction derived from each decreases |
|
|
Describe the relationship between an individual consumer’s demand and market demand |
Market demand is the sum of all individual demand curves for the same good |
|
|
Name the 9 non-pricedeterminants ofdemand |
- Income - Taste and Preferences - Price of related goods - Demographic changes - Government policies - Expectation of future income - Expectation of future prices - Seasonal change - Number of potential buyers |
|
|
Describe the non-price determinant of demand: INCOME |
people tend to shift their pattern of consumption and increase their spending when their income improves. Normal goods = income ↑, demand ↑ Inferior goods = income ↑, demand ↓ |
|
|
Describe the non-price determinant of demand: SEASONAL CHANGE |
Changes from one season to another may increase/decrease demand for particular goods e.g. snow recreation equipment |
|
|
Describe the non-price determinant of demand: NUMBER OF POTENTIAL BUYERS |
Larger markets = more potential buyers → more demand Smaller markets/trade restrictions = less potential buyers → fall in demand |
|
|
Describe the non-price determinant of demand: EXPECTATIONS OF FUTURE INCOME |
Future INCOME: - During periods of economic growth, rising wages, and low unemployment, consumer become confident in increasing incomes and so consume more = increased demand - During a recession, rising unemployment and falling wages = lower consumer confidence as consumers are discouraged from buying goods and demand decreases |
|
|
Describe the non-price determinant of demand: TASTE + PREFERENCES |
Demand for goods change as they become more or less popular because of fashion, current events, and word-of-mouth recommendations |
|
|
Describe the non-price determinant of demand: GOVERNMENT POLICY |
Changes in taxation and subsidies policies affect demand. Increased income taxes = decrease in consumption as households have less income available to spend. Restriction and regulation of behaviour and product safety can also affect demand. |
|
|
Describe the non-price determinant of demand: DEMOGRAPHIC CHANGE |
Demand can change with major shifts in the age structure, income distribution, or other demographic traits. For example, if the share of the national income shifts towards the rich, demand for luxury goods will increase |
|
|
Describe the non-price determinant of demand: PRICE OF RELATED GOODS |
Substitute goods: alternatives to each other. Price of one ↑ = demand for substitute ↑
Complementary goods: goods commonly bought together. Price of one ↑ = demand for complementary good ↓ |
|
|
Describe the non-price determinant of demand: EXPECTATIONS OF FUTURE PRICES |
- expectation of higher prices = consumers are inclined to purchase more immediately so demand ↑ - expectation of lower prices = consumers defer purchases until product becomes cheaper so demand ↓ |
|
|
Describe the relationship between an individual producer’s supply and market supply |
Overall market supply for a good is the sum of all the individual supply curves for the good |
|
|
Shift in supply vs. movement along a supply curve |
A change in product price = movement along supply curve A change in non-price determinants of supply leads to a shift in the entire supply curve |
|
|
Name the 5 non-pricedeterminants of supply |
- costs of production - productivity - government intervention - price of related goods - supply shocks |
|
|
Describe the non-price determinant of supply: COSTS OF PRODUCTION |
Changes the the price and availability of the factors of production can lead to changes in the costs of production. If these costs rise, it is more difficult for producers to make a profit so production either falls (reduced supply) or shifts to a more profitable good. |
|
|
Describe the non-price determinant of supply: PRODUCTIVITY |
Increased productivity shifts supply to the right (it increases) as efficiency increases. |
|
|
Describe the non-price determinant of supply: GOVERNMENT INTERVENTION |
- regulation increases costs to producers, lowering supply - taxes decrease profits and so are likely to lead to reduced production of the taxed product - subsidies reduces production costs and in turn encourage increased supply of the product |
|
|
Describe the non-price determinant of supply: PRICE OF RELATED GOODS |
Firms can substitute the supply of goods from those earning lower prices to those getting better ones. This is more true of joint supply goods, for example corn can be used to produce corn syrup or ethanol. Increased demand for biofuels have led to increased production of ethanol and less resources available to produce corn syrup. |
|
|
Describe the non-price determinant of supply: SUPPLY SHOCKS |
Destruction caused by, for example floods and earthquakes, can reduce the supply of certain raw products, goods, and services. |
|
|
Supply shocks |
Random events that can disrupt the normal supply of goods and services. Rarely, these events can improve supply situations |
|
|
Removing excess supply |
When more quantity is supplied than demanded, producers must sell the extra goods by lowering the price. As prices fall, quantity demanded rises and producers reduce production. This leads to an increasingly narrow gap until the surplus is reduced to zero at the market-clearing, equilibrium price |
|
|
Removing excess demand |
Market forces will lead to the prices increasing resulting in less and less quantity demanded until the market-clearing, equilibrium price is reached |
|
|
Excess demand |
The gap between relatively higher quantity demanded and lower quantity supplied |
|
|
Explain why choice results in an opportunity cost |
To choose one product over another we lose out on the opportunity to enjoy the other |
|
|
Role of price in resource allocation |
price has a signalling function and an incentive function,which result in a reallocation of resources when prices change as a result of a change in demand or supply conditions
- rightward demand shift causes temporary shortage - producers raise prices and produce more while consumers decrease amount demanded - results in new higher equilibrium price and signals product scarcity |
|
|
Elasticities - Implications for businesses |
- the degree to which consumers respond to changes in the price of a firm's product has major implications on a firm when it is considering raising or lowering its prices
- producers of some goods (e.g. competing car brands) must be aware of the effect that changes in the prices of other goods have on the market demand of their products |
|
|
Elasticities - Implications for governments |
- elasticities help governments decide which goods to place taxes on and whether or not to raise/lower income tax
- raising/lowering income tax with the goal of stimulating/reducing overall household spending may be futile if consumers' demand is unresponsive to changes in disposable income (inelastic goods) |
|
|
Elasticities and Tax Revenue |
Levying taxes on (elastic) goods for which consumers are highly sensitive to price changes will create little tax yet lead to a large decrease in the quantity sold in such markets |
|
|
The PED coefficient |
- negative because of the inverse relationship between price and quantity (law of demand)
- ignore the negative sign and express PED as an absolute, positive value |
|
|
Interpreting the PED coefficient: Inelastic Demand |
- when PED < 1 (greater than 0 but less than 1)
- % change in Qd is relatively less than the % change in price
- Thus, consumers are rather insensitive to changes in the price |
|
|
Interpreting the PED coefficient: Elastic Demand |
- when PED > 1
- % change in Qd is relatively more than the % change in price
- Thus, consumers are rather sensitive to changes in the price |
|
|
Interpreting the PED coefficient: Unit Elastic |
- when PED = 1
- % change in Qd is equal to the % change in price
|
|
|
Interpreting the PED coefficient: Perfectly Elastic Demand |
- when PED = Infinity
- any % change in price leads to an infinite change in Qd |
|
|
Interpreting the PED coefficient: Perfectly Inelastic Demand |
- when PED = 0
- Any % in price leads to no change in Qd |
|
|
Explain the determinants of PED: Substitutes |
Consumers will be more responsive to changes in the price of a good with a large number of substitutes |
|
|
Explain the determinants of PED: Proportion of income |
Demand for a good that tends to make up a large proportion of income tends to be more elastic since a particular % change in price appears bigger to the consumer than the same % change on a good that makes up a smaller proportion |
|
|
Explain the determinants of PED: Luxury or necessity |
Goods that are necessary will have less elastic demands than the luxuries they can do without if the price rises. |
|
|
Explain the determinants of PED: Addictive or not |
Addictive goods tend to have rekatuveky inelastic demand as consumers have a pshycial dependece on the good and are unwilling or unable to respond to changes in price to much degree |
|
|
Explain the determinants of PED: Time to respond |
Immediately following a price change, it is unlikely that consumers will notice or significantly adjust their consumption as it is difficult to identify substitutes in the short run.
In the long run, new options are available and so consumers can further reduce their consumption of the more expensive good |
|
|
PED Implications for businesses |
Being able to determine a good’s price elasticity of demand at a particular price allowsbusinesses that produce that good to make informed and sound decisions regarding theoptimal level of output and price in relation to the firm’s or industry’s total revenues. |
|
|
Examine the role of PED for firms in making decisionsregarding price changes and their effect on totalrevenue |

|
|
|
Examine the significance of PED for government inrelation to indirect taxes |
The price elasticity of demand of various goods also matters to economic policymakers,specifically regarding the question of what types of good should be taxed to generategovernment revenue. |
|
|
Explain why the PED for many primary commodities is relatively low and the PED for manufactured products is relatively high |
Primary products include agricultural as well as non-agricultural products. These products do not have close substitutes. However, manufactured goods experience extensive product differentiation as producers desperately try to gain an advantage over competitors.
Different types of fruit are not as close substitutes as different brands of laptops or cellphones, for example. Thus, PED for commodities is lower than that for manufactured products. |
|
|
Coefficient value of complementary vs substitute goods |
Complementary goods: negative XED coefficient (due to the inverse relationship between the price of good A and Qd of good B)
Substitute goods: positive XED coefficient (due to the positive relationship between the price of good A and Qd of good B) |
|
|
The (absolute) value of XED depends on... |
...the closeness of the relationship between two goods. The higher the XED coefficient, the more closely related the goods in question are to one another. |
|
|
Examine the implications of XED for businesses if pricesof substitutes or complements change |
The size of XED is used by policy makers to describe markets.
Firms can use XED to guide their pricing policy changes. Assumethat the price of a substitute product decreases, for example. If firms producing the good do not react, demand for it will probablydecrease. Or, if a complement becomes pricier then, assuming noreaction, its producer should expect demand for it to contract. |
|
|
Value of YED coefficient for normal and inferior goods |
YED coefficient for normal goods = positive due to the positive relationship between income and Qd
YED coefficient for inferior goods = negative due to the inverse relationship between income and Qd |
|
|
Distinguish, with reference to YED, between necessity (income inelastic) goods and luxury (income elastic) goods |
If a good is income elastic, then a particular percentage change in income will lead to alarger percentage change in the quantity demanded for the good.
If a good is income inelastic, then a particular percentage change in income will lead to asmaller percentage change in the quantity demanded for the good. |
|
|
Applications of income elasticity of demand (YED) for firms |
Firms would like to know whether demand for their product is highly income elastic or moderately income inelastic to help them better plan their investments. If an economy is growing and incomes are increasing fast, then firms producing highly income elastic products may have to invest now in expanding their capacity to be able to meet the increased demand. |
|
|
Compare YED of primary products, manufactured products, and services |
- relatively low YED for primary products - relatively higher YED for manufactured products - even higher YED for services |
|
|
Price Elasticity of Supply (PES) |
a measure ofthe responsiveness of aproducer of a particulargood to a change in theprice of that good |
|
|
Name the 4 determinants of PES |
- the amount of time following a change in price - the mobility of factors of production - the ability to store stocks - the amount of unused capacity. |
|
|
Explain the determinants of PES: time following a change in price |
The distinction isbased on the extent to which adjustments can be made.In the momentary (or market) period no adjustments arepossible. In the short run some, but not all, adjustments arepossible. In the long run all adjustments are possible. |
|
|
Explain the determinants of PES: mobility of factors of production |
The more mobile the factors of production, the more responsive a firm can be to changes in price. If labour is occupationally or geographically immobile then it will be more difficult to meet an increase in the demand for a product than if labour is mobile between occupations or regions. |
|
|
Explain the determinants of PES: unused capacity |
If an industry is operating at a level of output at which it has large amounts of unused capacity, then producers are able to quickly and easily respond to changes in the demand for the good in question.
If an industry is operating at or near full capacity, supply will be highly inelastic in the short run, as in order to meet any increase in demand firms must first acquire new capital equipment and open new factories to meet the rising demand for their output |
|
|
Explain the determinants of PES: ability to store stocks |
If it is possible to store stocks then it may be possible to meet an increase in demand by releasing stocks, so firms can be more responsive in their supply than if their goods are perishable or no stocks are held |
|
|
Excess capacity |
the amount a firm is able to produce in the short run without having to expand its plant size and the amount of capital and land employed in production |
|
|
Explain why the PES for primary commodities isrelatively low and the PES for manufactured products isrelatively high. |
Relatively elastic supply: manufactured goods and low-skilled services. Producers can easily hire more workers and acquire more raw materials and capital resources to meet increases in demand for such goods, thus they are highly responsive to increases in the price Relatively inelastic supply: primary commodities and heavy industrial goods. It is extremely time-consuming and costly tobring into production new plants for heavy industrial goodsand primary commodities to meet rising demand, or to takethem out of production in response to falling prices |
|
|
Explain why governments impose indirect (excise) taxes |
- revenue collection to finance government expenditure
- attempt todecrease the consumption of goods that are considered harmful
- switchexpenditures away from imports towards domestically producedgoods |
|
|
Discuss the consequences of imposing an indirect tax onthe stakeholders in a market |
Consumers - pay higher prices and receive less of the product
Producers - incur extra costs, produce less and are less likely to make profits
Government - taxes collected will increase government revenues
*taxes raise prices, reduce output, and shrink the market size |
|
|
Explain why governments provide subsidies, and describe examples of subsidies |
- increase the consumption of some goods by loweringthe price e.g. under-consumption of positive externality producing goods/services
- support a particular industry by helping withproduction costs
- address a balance of payments deficit by increasingexport revenue. Subsidies may lower costs enough tomake a particular good more competitive on the worldmarket. |
|
|
Discuss the consequences of providing a subsidy on the stakeholders in a market |
- making the good cheaper increases the amount consumeda nd produced - costs the government money - producers will earn more revenues both on a per unit basis and as a total - consumer spending on the good may increase, decrease or remain the same, depending on PED |
|
|
Price ceiling |
maximumlegally allowable pricefor a good, set by thegovernment |
|
|
Examples of price ceilings |
food price controls - Price ceilings on these products can cause hoarding of basic food items, black market prices, expectations of a shortage
rent controls - reduce the cost of housing for lower-income citizen |
|
|
Explain why governments impose price ceilings |
The government determines that there is great potential for high prices, and makes a goal of keeping prices low. Often governments take this step to make basic goods and services more affordable for poorer residents. Thus, by preventing an increase, the government places a ‘ceiling’ on the price of a good |
|
|
Examine the possible consequences/effects of a price ceiling: shortages |
the artificially low price has caused more demand for the product, whilst producers cutproduction in response |
|
|
Name the possible consequences/effects of a price ceiling |
- shortages - inefficient resource allocation - decreased market size - elimination of allocative efficiency - black markets - rationing |
|
|
Examine the possible consequences/effects of a price ceiling: rationing |
without price to guide the rationing of the good, consumers and producers will useother means to determine who receives the product. |
|
|
Examine the possible consequences/effects of a price ceiling: decreased market size |
At the low maximum price, the output will be limited to QS, a decrease from QE. This meansless overall utility to consumers and producers, a decrease in overall market surplus |
|
|
Examine the possible consequences/effects of a price ceiling: Elimination of allocative efficiency |
The price ceiling eliminates this efficiency. Now, the market price is set by the government, not where MB = MC (supply meets demand). Society is not producing enough of the good with the price ceiling in place |
|
|
Examine the possible consequences/effects of a price ceiling: Informal (black) markets |
The gap between QS and QD creates a tension in the market. At QS there are manyconsumers who would be willing to pay more than PMAX.
This suggests that some consumershave a strong incentive to pay more, informally or on the black market, to acquire thegood. |
|
|
Explain why governments impose price floors |
The government may believe the good is important or necessary, or it may be supporting employment in a particular industry. The motivation and effects of a price floor more specifically depend on the good itself |
|
|
Examples of price floors |
- price support for agricultural products: ensures a stable domestic food supply and attempt to raise farmers’ incomes by providing a better marketprice
- minimum wages: a tool to raiseliving standards among the poor |
|
|
Name the possible effects/consequences of a price floor |
- Surplus - Reduced market size - Cost inefficiency - Allocative inefficiency - Informal (black) markets
|
|
|
Consequence of minimum wages - price floor |
- raises the minimum pay for all workers, and those earning the worst wages will be able to get basic necessities
- produces a surplus = unemployment
- increase the incentive for firms to illegally hire workers below the minimum wage |
|
|
Examples of negative production externalities |
• Coal is produced with significant air pollution as a by-product, along with the deaths of hundreds of miners working in dangerous conditions every year.
• Oil production = costly as spills and refinery pollution cause significant external losses worldwide, not to mention the depletion of reserves. |
|
|
Potential solutions to negative production externalities |
Taxes - A tax will shift the MPC curve to the left, increasing the price and reducing demand
Tradable permits - a system for taxingpollution levels wherepollution licences areexchangeable betweenfirms on a secondarymarket
Legislation and regulation - Governments can enact laws to deter production of products or services that cause harm to others |
|
|
Evaluation of the use of taxes to correct negative production externalities |
Advantages - reduces the size of the externality (welfare loss) - internalizes the externality by compelling producers and consumers to pay the costsof their transaction - brings output down towards the optimal level
Disadvantages - assessing the magnitude of the externality is extremely difficult and expensive - determining the appropriate tax amount is a challenge - taxing the good may not deter pollution, only reduce it. |
|
|
Explain that demerit goods are goods whose consumption creates external costs |
Demerit goods are those that create negative spillover costs to third parties. Negativeexternality goods are generally considered to be demerit goods. Because of their extracosts to society, they are considered to be over-produced and over-consumed. An optimalallocation of society’s resources would reduce their use. |
|
|
Potential solutions to negative consumption externalities |
Taxes - Aims to ‘internalize the externality,' by compelling the market actors involved to pay the costs to society instead of the third parties
Advertising and persuasion - Attempts to persuade consumers to change their behaviour through advertising the negative effects of theproduct to discourage further use. In turn, consumers switch to other products that serve the same ends (e.g. public transport instead ofautomobiles) or merely reduce their consumption, shifting demand left
Legislation and regulation - Governments can ban/outlaw/restrict the consumption of goods with high spillover costs to society e.g. age restrictions on alcohol |
|
|
Positive externalities of production examples |
- Tree farms created for the production of wood oxygenate the atmosphere to everyone’s benefit
- A school placed in a neighbourhood may improve the property values of families with no children in school
- Workers trained by one company can be hired by another which enjoys the benefits of the training |
|
|
Explain that merit goods aregoods whose consumptioncreates external benefits |
Merit goods or services are those that create positive spillover benefits, and are underproducedby the free market. Economists and governments advocate policies thatencourage the consumption of these goods to capture potential welfare gain that wouldnot be enjoyed without such intervention.
The degree of government provision or encouragement isdirectly related to the amount of spillover benefits provided by the good. |
|
|
2 Potential solutions to positive externalities of production |
- Subsidies: The government can actively encourage extra production by the payment of subsidies. However, it is paid for by tax revenue = opportunity cost and may create a political problem as other firms appeal for subsidies
- State provision of the article: In the case of worker training or tree farming, the government may decide to provide directly the good creating the positive externality. However, this can be costly and depends on government accurately predicting the needed training shortage areas. |
|
|
Potential solutions to positive externalities of consumption |
- Subsidies: Makes the good more affordable. They can and often do subsidize education.
- Advertising: To encourage consumption, governments can advertise the benefits of positive consumption externality goods.
- Legal requirements: Governments can legally mandate behaviour that it deems to the public benefit. It can require children go to school to a certain age, or to get vaccinations. However, unless the good is publicly provided, full compliance is unlikely and can foster resentment of government policy. |
|
|
Using the concepts of rivalry and excludability, and providing examples, distinguish between public goods and private goods |
public goods = non-rivalrous and non-excludable
private goods = rivalrous and excludable
Non-rivalrous: A good is non-rivalrous if one person’s consumption of it does notprevent others from enjoying it.
Non-excludable: A good is non-excludable if the producer cannot prevent particularindividuals from enjoying its benefits. |
|
|
Examples of public goods and private goods |
private goods: clothing, food, electronics
public goods:national defence, police and firedepartments, lighthouses |
|
|
Explain, with reference to the free rider problem, how the lack of public goods indicates market failure. |
Common access resources are subtractable and are essentially ‘free’ to the user, but use of them depletes the availability of the resource to everyone else.
Because users do not pay a market price for use of the good, they have little incentive to ration it wisely. Those who benefit and draw from a resource but do not have to pay for it are free riders |
|
|
Examples of the free rider problem |
- Water sources in nearly every country are receivers of toxic waste, thus diminishing ecosys
- Forests are slashed for wood and to make way for farming, which reduces oxygen production and erodes the soil. |
|
|
Apply the concept ofsustainability to the problemof common access resources |
The tragedy of the commons is a dilemma posed whencommon resources are used or degraded rapidly by privateindividuals who enjoy the short-term benefits of theresource, but who are ignorant or neglectful of its long-termdepletion.
The goal of sustainable development is to avoid resource depletion and encourageenvironmentally benign forms of economic progress |
|
|
Explain, using examples,common access resources. |
Common access resources (such as fisheries and timber) often resultin over-exploitation, dueto their non-excludability. |
|
|
Discuss the view that the existence of poverty in economically less developed countries creates negative externalities |
overexploitation of land for agriculture poses a threat to sustainability
LDCs rely on their agricultural or primary goods to keep up with MDCs and debt. This puts pressure on their resource base.
For agriculture-based economies, it means more intensive cultivation and the potential to deplete the soil of its nutrients and the widespread slashing of forests to make way for farms and livestock.
For extractable resources, it might result in mining and drilling operations without regard for the effect on the landscape, or on soil and water resources. |
|
|
Evaluate, using diagrams,possible governmentresponses to threats tosustainability |
- legislation
- carbon taxes: The tax acts as adisincentive to use fossil fuels, and encourages the demand for (and development of) non carbon-emittingsubstitutes.
- cap and trade schemes (tradable permits): The licence payment acts as an incentive for firms who might be able to produce more cleanly. If they canget their production below the licensed amount, they can sell their permits to other firms.
- funding for cleantechnologies
- extension of property rights: in the case of common access resources, the lack of a price mechanism leads to a depletion ofresources. An extension of property rights encourages the protection and management of the scarce resource. |
|
|
Carbon Taxes |
a charge levied by government on firms burning fossil fuels in theirproduction processes. Potential responses to common access goods threats to sustainability. |
|
|
Limitations to government responses to threats to sustainability |
A common difficulty with solutions to sustainability problems is the difficulty of enforcement of policies to encourage sustainable growth. The global nature of the problems and the lack of ownership of common access resources creates problems. Effective responses require international cooperation. |
|
|
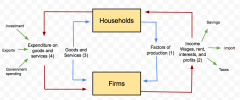
Explain, using a diagram,the circular flow of incomebetween households andfirms in a closed economywith no government |
|
|
|
Injections: circular flow model |
Money that enters the system: government spending, investments, exports |
|
|
Leakages: circular flow model |
Money that exits the system e.g. taxes, imports, savings |
|
|
Outline the relationship between the values of the income flow, expenditure flow and output flow |
The circular flows must be equal . All the income generated in the production process is spent on the output produced, so the income flow is equal to the expenditure flow which is equal to the output flow. |
|
|
Explain the difference between GDPand GNP/GNI as measures of economic activity |
GDP measures production within the borders of a country, regardless of who owns the factors of production. GNP attempts to measure the flow of income based on actual ownership of the factors of production by subtracting any payments to foreign factors of production and adding any factor payments from domestically owned factors of production located in other countries from GDP. |
|
|
GNP equation |
GNP = GDP + net property income from abroad |
|
|
Distinguish between GDP and GNP/GNI as measures of economic activity |
Gross domestic product refers to all production domestically, or within the geographical area. Gross national product suggests that nationality of ownership is paramount for this measure. |
|
|
Nominal GDP |
The value, in current prices, of all final goods and services produced in a country within a given time period |
|
|
Real GDP |
The value, in constant prices, of all final goods and services produced in a country within a given time period, usually measured against prices of predetermined base year |
|
|
Describe the 3 main methods of measuring national income |
- Expenditure method: sums the total spending on final new goods andservices in a given year
- Output method: sums all domesticallyproduced final goods and services
- Income method: sums all incomes generated inthe domestic production process |
|
|
Evaluate the use of national income statistics |
- Useful for makingcomparisons over time - Useful for making comparisonsbetween countries - Useful for making conclusionsabout standards of living - Information is political power: empowers voters - Economic data enables better policy making and adjustments |
|
|
Green GDP |
measure of GDP that accounts for environmental destruction |
|
|
Explain the meaning and significance of “green GDP” |
Seeks to estimate a country’saggregate output while factoring in any output losses created by environmental degradation. Establishes a monetary value to soil erosion, water pollution, loss ofbiodiversity, and contributions to climate change. The approach is controversial becauselosses from environmental damage are very difficult to estimate accurately. |
|
|
Evaluate the usefulness and accuracy of GDP data |
GDP overestimates well-being - Adding clearly negative social behaviours and transactions as net positivesfor GDP - Under-reporting the loss of natural resources.
GDP underestimates well-being - The fact that people are living longer is not included - Black and underground market activity is not included - Unpaid output is not counted - GDP adds market transactions, regardless of the quality of output
GDP lacks information - GDP does not measure many aspects of quality of life - GDP provides no information about the distribution of income - GDP does not account for purchasingpower |
|
|
What does the Business Cycle illustrate? |
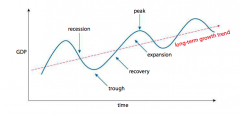
Economies typically tend to go through a cyclical pattern characterized by the phases of the business cycle.
|
|
|
Business Cycle |
The fluctuations of national income from expansion to contraction to recovery. It can also be associated with changes in price levels |
|
|
Recession |
Two consecutive quartersof declining national output / if the economy contracts over a six-month period = negative growth rate |
|
|
Recessionary trough |
The lowest point of a recession. Nobody really knows exactly when this point is reached until output has begun to recover and growth has resumed |
|
|
Recovery |
An increase in GDP from a recessionary level to match the level of output produced before the recession. The economy is getting back to where it was before the contraction |
|
|
Expansion |
When the economy grow beyond its previous level of output. |
|
|
Peak |
The apex of an expansion, occurs just before a recession. No one really knows (until afterwards) when a peak has been reached. |
|
|
Explain why the AD curve hasa negative slope |
There is an inverse relationship between AD and the price level: at lower pricelevels there is greater amount of output demanded and at higher price levels the amount ofoutput demanded decreases |
|
|
Aggregate Demand Component: Consumption |
Measures all spending by domestic households ongoods and services during a particular period of time |
|
|
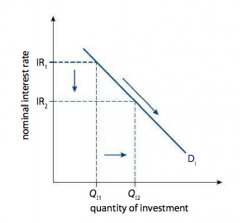
Aggregate Demand Component: Investment |
Measures the total spending by firms on capital equipment. The level of investment in a nation is a function of the national output and the interest rate |
|
|
Aggregate Demand Component: Government spending |
Measures a country’s government’s expenditures on goods and services. |
|
|
Aggregate Demand Component: Net exports |
Measures the total income earned from the sale ofexports (X) to foreigners minus the total amount spent by a nation’s households, firmsand government on goods and services imported (M) from other countries |
|
|
Explain how the AD curvecan be shifted by changesin consumption: Interest Rates |
In response to a rise in the price level, banks raise the interest rates on loans to households and firms who wish to consume or invest. At higher interest rates, the quantity demanded of products and capital for which households and firms must borrow decreases, as borrowers find higher interest rates less attractive |
|
|
Name the 5 factors that show how the AD curvecan be shifted by changesin investment |
- interestrates - business confidence - technology: New technologies often lead to periods of increased investment by firms adopting thetechnology or providing goods and services to consumers that incorporate the newtechnology - business taxes - the level of corporateindebtedness |
|
|
Name the 2 priorities that explain why the AD curve can be shifted by changes in government spending |
political and economic priorities |
|
|
Explain how the AD curvecan be shifted by changesin net exports |
- income oftrading partners - exchangerates - changes in the levelof protectionism |
|
|
Name the 5 five factors that cause the AD curve to shift due to changes in consumption |
- consumer confidence
-interest rates
- wealth
- personal income taxes (thus, disposable income)
- level of household indebtedness |
|
|
Explain how the AD curve can be shifted by changes in consumption: Wealth |
The public feels poorer at higher price levels and thus demands a lower quantity of the nation’s output when price levels are high |
|
|
Explain how the AD curve can be shifted by changes in consumption: Level of household indebtedness |
If private(household) debt has accumulated, household spending willto decline as households will need to pay more and more toservice their debt. This will put a damper on consumptionexpenditures and so tend to decrease AD, shifting it to the left. |
|
|
Explain how the AD curve can be shifted by changes in consumption: Consumer confidence |
households feeling secure andconfident about their future will tend to spend more |
|
|
Explain how the AD curve can be shifted by changes in consumption: Personal income taxes |
Lower disposable income as a result of higher PIT will tend to decrease consumption expenditures and so decrease AD, shifting it to the left |
|
|
Name the 4 Macroeconomic Objectives |
- Low unemployment - Low and stable rate of inflation - Equity in the distribution of income - Economic growth |
|
|
Unemployment |
The condition of someone of working age (16–64) who is willing and able to work, actively seeking employment, but unable to find a job |
|
|
Explain the difficulties in measuring unemployment |
- existence of hidden unemployment
- existence of underemployment
- it is an average and therefore ignores regional, ethnic, age and gender disparities |
|
|
Discuss possible economic consequences of unemployment |
- loss of GDP, lower AD, under-utilization of the nation’s resources - loss of tax revenue - increased cost of unemployment benefits = increased budget deficits - loss of household income and purchasing power for individuals - greater disparities in the distribution of income - brain drain |
|
|
Discuss possible personal and social consequences of unemployment |
- increased poverty crime rates - increased stress levels - increased indebtedness - homelessness and family breakdown - downward pressure on wages for the employed |
|
|
Cyclical (demand-deficient) Unemployment + example |
Occurs when a contraction in private or publicspending (consumption, investment, government spending or net exports) reduces ADand leads to a fall in national output. As output of goods and services falls the demand forlabour falls and there is downward pressure on wages and prices.
Weak AD explains the doubling of the unemployment rate in the US between 2008 and 2009 |
|
|
Frictional Unemployment |
Workers who are in between jobs or just entering the labour force for the first time. Generally short-term and is often voluntary in nature. |
|
|
Seasonal Unemployment + example |
Workers who do seasonal labour (e.g. golf course employees, migrant farmers, ski-liftoperators or summer-camp instructors) may be unemployed between seasons |
|
|
Structural Unemployment + example |
Long-term unemployment where a worker loses his job due to the changing structure of the nation’s economy and their skills are no longer in demand in the new economy
Occurs when a developing country moves from an agricultural base to a manufacturing base and farming techniques become less labour intensive and more capital intensive. When a more developed nation transitions from a manufacturing base to a larger service sector, factory workers’ skills may no longer be in demand, while the demand for highly educated and highly skilled ‘knowledge workers’ increases |
|
|
Reducing Structural Unemployment |
a nation must investheavily in public education and training for adult workers in the skills that will be neededfor the future economy, rather than those that were needed for the economy of the past oreven the present |
|
|
Evaluate government policiesto deal with the differenttypes of unemployment: Frictional + Seasonal Unemployment |
Improve information symmetrybetween employers and job seekers;reduce unemployment benefits. |
|
|
Causes of Structural Unemployment |
- changes inthe demand for particularlabour skills - changes in thegeographical location ofindustries - labour marketrigidities |
|
|
The natural rate of unemployment (NRU) |
An economy producing at full employmentstill experiences frictional, seasonal and structural unemployment. These combined areknown as the natural rate of unemployment. |
|
|
Evaluate government policies to deal with the different types of unemployment: Structural Unemployment |
Improve training, education and mobility of labour force to encourage relocation as demands for labour change in regional areas. |
|
|
Evaluate government policies to deal with the different types of unemployment: Natural rate of unemployment (NRU) |
A nation’s nrU can be reduced viagovernment policy aiming to increaseproductivity of the labour force andcreate incentives to accept work. |
|
|
Evaluate government policies to deal with the different types of unemployment: Cyclical Unemployment |
Implementation of fiscal or monetary stimulus aimed at increasing the level of AD and raising the nation’s output and employment. |
|
|
Typical measurements of inflation and deflation |
Calculated with consumer price index (CPI), which measures the change in prices of a basket of goods and services consumed by the average household |
|
|
Discuss the possible consequences of a high inflation rate |
- greater uncertainty - redistributive effects - lower real interest rates for savers = less saving - damage to export competitiveness: domestic output less attractive to foreigners, and imports more attractive to domestic consumers - loss of purchasing power: as prices rise and household incomes remain constant or rise at a slower rate than inflation, people become poorer in real terms |
|
|
Discuss the possible consequences of deflation |
- high levels of cyclical unemployment - bankruptcies - falling consumption and increased savings - falling investment - increased debt burden on households. |
|
|
Shortcomings of the CPI as a measure of inflation: Different income earners |
Different incomeearners may experience adifferent rate of inflation whentheir pattern of consumptionis not accurately reflected bythe CPI.
Not all of a nation’s households are typical in that the income of a nation is not evenlydistributed across all households. Some consumers will typically purchase a very differentbasket of goods than is measured to determine the CPI and inflation. |
|
|
Shortcomings of the Consumer Price Index (CPI) as a measure of inflation: Inflation figures |
Inflation figures may not accurately reflect changes in consumption patterns and the quality of the products purchased. Inflation calculated using the CPI may not measure changes in prices of important products like food and oil |
|
|
Shortcomings of the CPI as a measure of inflation: Price changes that affect producers |
A nation’s inflation rate is typically reported based on a consumer price index. For businessfirms, however, a more useful measure of inflation is the producer price index (PPI).
A producer priceindex measuring changesin the prices of factors ofproduction may be useful inpredicting future inflation |
|
|
Shortcomings of the CPI as a measure of inflation: Prices of important products |
Inflation calculated using the CPI may not measurechanges in prices of important products like food and oil and so doesn't accurately reflect the effect that inflation is having on the typical household |
|
|
Definition and cause of Demand-pull Inflation |
An increase in prices arising fromthe increased overall demand for a nation’s output when consumption, investment,government spending or net exports rise without a corresponding increase in the level ofAS |
|
|
Definition and cause of Cost-push Inflation |
When the costs of production rise (due to higher energy costs, wages for workers, business taxes, etc.) so the nation’s SRAS curve shifts to the left and the average price level of the nation’s output rises |
|
|
Compare the causes and diagrammatic illustration of cost-push and demand-pull inflation |
demand-pull inflationis caused by changes in the determinants of AD, resulting in an increase in AD
cost-push inflation is caused by an increase in the costs of factors of production, resulting in a decrease in SRAS |
|
|
Who Is Helped and Hurt by Inflation? |

|
|
|
Causes of supply-side deflation |
- lower oil prices - lower minimum wage - more productive labour force - better infrastructure - appreciation of the nation’s currency - lower corporate taxes |
|
|
How is economic growth shown and caused in relation to a production possibilities curve (PPC) diagram? |
an increase in actual output resulting from factors such as the utilization of unemployed resources and increases in productive efficiency, leading to a movement of a point inside the PPC to a point closer to the PPC. |
|
|
Evaluate the view that increased investment is essential to achieve economic growth |
Higher national levels of private investment increase the quantity and the quality ofphysical capital, which makes workers more productive and leads to long-run economicgrowth. Without high levels of private investment,improvements in technology would be slow to come to the market and economic growthwould be hindered because economies would lack access to cutting-edge, productivity improvingmethods of production |
|
|
Evaluate the view that improved productivity is essential to achieve economic growth |
Resources are scarce: this is the basic problem of economics, which addresses questions surrounding the allocation of earth’s scarce resources. Improved productivity enables sustainable economic growth despite scarce resources. |
|
|
Causes of economic growth |
PRODUCTIVITY GROWTH: An outward shift of a nation’s PPC is made possible only by an increase in the quantity or the quality of productive resources in the nation. |
|
|
2 Sources of productivity growth |
- improved physical capital: increase in the quantity and the quality of the physical capital available to each worker in a nation. This leads to vast improvements in worker productivity and, therefore, higher rates of growth
- improved human capital: achieved through improvements in the education and health of a nation’s workforce |
|
|
Physical capital |
the human-made resources employed in the production of goods or services - e.g. factories,robots, computers, buildings, tools etc. |
|
|
Better source of productivity growth: Human Capital vs Physical Capital |
Physical capital is limited by the scarcity of natural capital. Human capital, on the other hand, is effectively limitless, to the extent that it can be improved through education. Human capital can overcome thephysical scarcity of natural resources and thereby achieve long-run economic growth even in the face of resource depletion. |
|
|
Discuss the possible consequences of economic growth |
- improved living standards: increased output per person = increased levelsof consumption, and in turn welfare
- structural unemployment
- inflation: Growth achieved primarily through increases in AD can result in greater output per workerbut also inflation
- unequal distribution of income: The benefits of economic growth may be enjoyed by an elite minority within the nation’seconomy rather than the lower skilled, working class
- shift to deficit in current account of thebalance of payments: Rising domestic incomes generally lead to a net inflow of goods from the rest ofthe world, shifting a nation towards a deficit in its trade balance with other countries
- sustainability/resource depletion: In its pursuit of greater output, anation’s non-renewable resource base may be depleted at an unsustainable rate
- externalities: Increases in a nation’s output often lead to decreases in environmental and physicalhealth |
|
|
Explain the difference between equity in the distribution of income and equality in the distribution of income |
Equity refers to fairness ineconomics, while equalitymeans minimizing thedisparities in income andwealth among a nation’shouseholds. Equityultimately promotesgreater equality in incomedistribution |
|
|
Why may the market system not result in an equitable distribution of income? |
Due to unequal ownership of factors of production |
|
|
Draw a Lorenz curve and explain its significance |
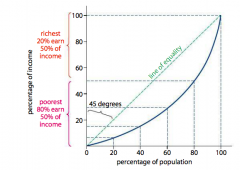
The Lorenz curve is a graphical representation of a country’s income distribution. It plots the cumulative percentage of the nation’s income across the cumulative percentage of thepopulation. The shape of a country’s Lorenz curve tells us much about thecountry’s income distribution. |
|
|
Explain how the Gini coefficient is derived and interpreted |
The Gini coefficient is the ratio of the area above a country’sLorenz curve and below the line of equality to the total area below the line of equality. The higher the ratio,the greater the inequality in acountry. |
|
|
Distinguish between absolute poverty and relative poverty |
Relative poverty is the condition experienced by people in a country whose incomes areconsiderably lower than the higher income groups in the same country. |
|
|
Relative poverty |
The condition experienced by people in a country whose incomes are considerably lower than the higher income groups in the same country. |
|
|
Absolute poverty |
The condition experienced by individuals who cannot afford to acquirethe basic necessities for a healthy and safe existence |
|
|
Explain 3 possible causes of poverty |
- low incomes: cannot afford to buy the necessities required to maintain a healthy, comfortable standardof living
- unemployment: the lack of a job reduces a household’s ability to meet its material needsand wants
- lack of human capital: without education, skills, and access to healthcare, individuals willbe less productive; they will produce and consume at a reduced level of income |
|
|
Explain 3 possible consequences of poverty |
- low living standards - lack of access to healthcare and education = unlikely to contribute to national output and economic growth - social unrest: can lead topolitical and economic instability for a nation |
|
|
Distinguish between progressive, regressive and proportional taxation |
regressive tax: the percentage decreases as the taxpayer’s income rises
proportional tax: the proportion of income paid in tax is constant at all income levels
progressive tax: the percentage paid in tax increases as income rises |
|
|
Example of proportional tax |
US social security tax |
|
|
Name the 3 types of taxes |
1. Proportional 2. Progressive 3. Regressive |
|
|
Example of progressive tax |
Income tax |
|
|
Example of regressive tax |
Although they appear to be equitable since everyone pays the same percentage ofthe price of the goods they consume, indirect taxes such as VAT, GST and sales taxes place a larger burden on those whose ability to pay is lower and asmaller burden on the higher-income earners whose ability to pay is greater |
|
|
Regressive tax |
The percentage decreases as the taxpayer’s income rises |
|
|
Proportional tax |
The proportion of income paid in tax is constant at all income levels |
|
|
Progessive tax |
The percentage paid in tax increases as income rises, allowing for those with the greatest ability to pay to pay the greatest proportion of a nation’s tax |
|
|
Explain the term transfer payments |
Another means by which government redistributes the nation’s income is through the provision of transfer payments from high-income groups to low-income groups. A transfer payment is a payment from the government to an individual for which no goodor service is exchanged |
|
|
Examples of transfer payments |
- old age pensions - unemployment benefits - child allowances |
|
|
Sources of government revenue |
The governmentearns revenue primarily fromtaxes (direct and indirect), aswell as from the sale of goodsand services and the sale ofstate-owned (government owned)enterprises |
|
|
Evaluate government policies to promote equity in terms of their potential positive or negative effects on efficiency in the allocation of resources |
- taxation - government expenditure - transfer payments
A nation that successfully employs an equitable system of taxes and government spendingis likely to achieve a more equal distribution of its income, reduce poverty, increaseproductivity, and thereby promote the achievement of its other macroeconomic objectivesin the process.
A progressive income tax system provides governments with an effective means of redistributingthe nation’s income because those with the greatest ability to pay provide the nation with far more of its tax revenue than those with the least ability to pay. |
|
|
Evaluate the use of progressive taxes to promote equity |
Taxing higher incomes at higher rates (progressive taxes) creates a disincentive to work by punishing any increase in productivity or effort among workers. However, higher rates only apply to marginal income, rather than total income, ensuring that a worker’s after-tax income is always an increasing function of gross income. Therefore, there is always an incentive to increase income by working harder, longer, or more efficiently. |
|
|
3 types of government expenditures |
- current expenditures - capital expenditures - transfer payments |
|
|
Distinguish between a budget deficit, a budget surplus and a balanced budget |
- budget deficit: If the totalgovernment expenditurein a given year exceeds thetotal revenue brought infrom taxes in that year - budget surplus: If, in a given year, a government’s tax revenue collected exceeds its expenditure. This reduces national debt. - balanced budget: If agovernment’s expenditure exactly equals its tax revenue |
|
|
Fiscal policy |
The government’s use of taxes and spending to influence the overall level of aggregate demand in the economy to promote macroeconomic objectives |
|
|
National debt |
The accumulation of all past years’ deficits |
|
|
Explain the relationship between budget deficits/surpluses and the public (government) debt |
In a deficit year, the national debt grows by the amount of the budget deficit. In a surplus year,the size of the surplus is subtracted from the national debt. |
|
|
Explain how changes in the level of government expenditure and/or taxes can influence the level of aggregate demand in an economy |
As a component of AD, government spending can have powerful effects on economic activity. By increasing or decreasing the level of government spending on goods and services, overall demand can be directly influenced through fiscal policy. By changing the level of taxation on households and firms, the level of consumption and investment can be indirectly influenced through fiscal policy |
|
|
Explain automatic fiscal policy |
In most nations, tax and government spending systems have an element of built-in stability through which an increase in GDP is automatically accompanied by a decrease in government spending and an increase in taxes. A fall in total output and income, on the other hand, automatically results in an increase in government spending and a decrease in taxes. |
|
|
Explain discretionary fiscal policy |
a change in taxes and spending undertaken by government with the explicit aim of either stimulating or contracting the overall level of demand in the economy to promote economic stability and full employment |
|
|
Explain the mechanism through which expansionary fiscal policy can help an economy close a deflationary (recessionary) gap |
During times of recession, expansionary fiscal policy can stimulate the economy. When private consumption, investment and export sales fall during a recession, an increase in government spending and a decrease in taxes can offset the fall in other spending and move AD and GDP back towards the full-employment level. |
|
|
Expansionary fiscal policy |
a decrease in taxes and/or an increase in government spending aimed at increasing the level of aggregate demand |
|
|
Explain the mechanism through which contractionary fiscal policy can help an economy close an inflationary gap |
Higher taxes will reduce households’ disposable income and reduce the level of consumption and investment by firms. A decrease in government spending directly reduces the level of AD and puts downward pressure on the rate of inflation,moving the economy closer to its full-employment level of output |
|
|
Contractionary fiscal policy |
An increase in taxes and/or a decrease in government spending aimed at decreasing aggregate demand to close an inflationary gap and moving the economy to its full-employment level of output and price level stability. |
|
|
Fiscal policy and its impact on potential output |
fiscalpolicy can be used to promotelong-term economic growth(increases in potential output)indirectly by creating aneconomic environmentthat is favourable to privateinvestment, and directlythrough government spendingon physical capital goods andhuman capital formation, aswell as provision of incentivesfor firms to invest |
|
|
Evaluation of fiscal policy: Advantages |
- Fiscal policy is direct: any increase in government spending will automatically increase national income by at least as much, if not more, as it is a component of AD. - Lower taxes improve the incentives to work and to invest: a decrease in taxes to reflate an economy as part of an expansionary stimulus plan may also have beneficial supply-sideeffects |
|
|
Evaluation of fiscal policy: Disadvantages |
- Significant time lags: to detect problem, decide what to do, and execute the policies - Political influence over fiscal policy: Politicians may promote and push through fiscal policies that are popular among voters, even if they are economically irresponsible - Net exporter effect: During a contractionary fiscal policy, lower interest rates on domestic government bonds reduce demand for the currency, causing it to weaken and increasing demand for exports. The increase in net exports may offset the desired contractionary effect of the fiscal policy - Crowding Out - Impact depends on extent of recession
|
|
|
The role of central banks |
Regulators of commercial banks and bankers to governments. Usually made responsible for interest rates and exchange rates in order to achieve macroeconomic objectives |
|
|
Money supply |
the combined value of the currency and demand deposits of a country |
|
|
Money demand |
Includes the desire to hold money as an asset and the demand for money as a means to purchase goods and services. It is inversely related to the interest rate and it increases or decreases with the overall level of national output |
|
|
Impact of money supply on interest rates |
With a smaller money supply,most interest rates increase, and buying anything with borrowed money becomes moreexpensive. With a larger money supply, most interest rates throughout the economy will drop, andbuying everything with borrowed money becomes cheaper. |
|
|
Explain how equilibrium interest rates are determined |
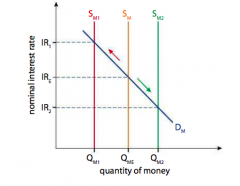
an increase or a decrease in the money supply canraise and lower the interest rate as the equilibrium moves up and down along the moneydemand curve. The original equilibrium is determined by the intersection of DM and SM,which sets the ‘price’ of money at IRE and the quantity at QME |
|
|
Explain the mechanism through which easy (expansionary) monetary policy can help an economy close a deflationary(recessionary) gap |
The central bank lowers interest rates and increases money supply in order to promote growthin the economy. This can also increase inflationary pressures. |
|
|
Explain the mechanismthrough which tight (contractionary) monetary policy can help an economy close an inflationary gap |
The central bank increases interest rates and decreases money supply in order to reducegrowth in the economy. This can also reduce inflationary pressures. |
|
|
Explain how changes in interest rates can influence the level of aggregate demand in an economy |
- government spending is least likely to be affected because it is determinedindependently of interest rates
- private investment is thecomponent most highly sensitive to the rate of interest. Firms will choose to borrow if they can earn morethan the interest they pay on the borrowed funds
- some consumption of high-pricedgoods (cars, appliances) can be influenced by interest rates, much more consumption isdetermined by income, expectations and other factors |
|
|
Contractionary monetary policy |
When the central bank to decrease the money supply and increase interest rates. |
|
|
Evaluation of monetary policy: Strengths |
- Speed: Can be enacted by the central bank as soon as the problem isrecognized. Less compromises and bureaucracy, policy decisions are relatively immediate, which improves the chances of a expansionary policy going into effect while the recession is still underway.
- Control: It is within the power of the central bank to adjust the money supply more discretely and finely than legislators can with fiscal policy.
- No politics: Most central banks are held to be independent of politics, which prevents the desires of voters from influencing policy.
- No crowding-out: Expansionary fiscal policy typically requires the government to borrow money. Massive borrowing drives up interest rates and limits long-term growth. Monetary policy, by lowering interest rates, avoids this disadvantage. |
|
|
Evaluation of monetary policy: Weaknesses |
- Investors reluctant to borrow: Money may be cheap, but consumers and investors lack the confidence that they will easily repay the loans. Large purchases and spending = deferred, saving increases, firms in turn reduce output and investment. This renders the reduction of interest rates rather meaningless.
- Time lags: While monetary policy is quick to implement, it takes time to go into effect.Lower rates may spur borrowing in relatively good years, but not immediately. Thespeed at which interest rate changes have effect is influenced by elasticity of demand forinvestment.
- Changes in elasticity of demand for investment: effects impact of changed IR on investment |
|
|
Supply-side policies |
a combination ofgovernment-led and freemarket policies designedto increase the productivecapacity of the country |
|
|
Aim of supply-side policies |
to shift the LRAS curve to the right, achieving growth in potential output |
|
|
2 types of supply-side policies |
1. Market-based 2. Interventionist |
|
|
Name the 3 methods in market-based supply-side policy |
1. Policies to encouragecompetition 2. Labour market reforms 3. Incentive-related policies |
|
|
Types of market-based supply-side policy: Policies to encouragecompetition |
- deregulation: reduce bureaucracy as well as the required costs of complying withgovernment rules
- privatization: rather than government ownership/control, privatization encourages owners to lower costs and thus prices
- trade liberalization: encourages free trade, reduction of trade barriers and open competition
- anti-monopolyregulation: prevent or dismantlemonopolies in the market to allow it to grow, create more choice, and lower prices |
|
|
Types of market-based supply-side policy: Labour market reforms |
Reducingunemployment benefits (reduces the incentive to findemployment), diminishing trade union power, andabolishing minimum wages (which creates a surplus of workers = unemployment benefits cost) are used to make the labourmarket more flexible = responsive to supply anddemand |
|
|
Types of market-based supply-side policy: Incentive-related policies |
Reduced income tax cuts are used to increase the incentive to work, and cuts in business tax and capital gains tax are used to increase the incentive to invest and improve profits so encourages increased output = increased employment |
|
|
Evaluation of market-based supply-side policies: Strengths |
- Policies to encourage competition = more consumer choice and better value for consumers.
- Reduced government intervention in the labour market = more flexible and responsive to market forces |
|
|
Evaluation of market-based supply-side policies: Weaknesses |
- The effectiveness of privatization, however, depends largely on the manner in which it is enacted
- social costs of deregulation = unsafe products, dangerous work places andpolluted environments
- disappearance of much of the safeguarding work that unions do |
|
|
Name the 4 methods in interventionist supply-side policy |
1. investment in human capital 2. investment in new technology 3. investment in infrastructure 4. industrial policies. |
|
|
Interventionist supply-side policies |
government ledattempts to increasethe productive capacity ofthe country. |
|
|
Types of interventionist supply-side policies: Investment in human capital |
Investment ineducation, health care services and training improves the skills and productivity of the workforce and so willraise the levels of humancapital and have a short-termimpact on aggregate demand,but more importantly willincrease LRAS |
|
|
Types of interventionist supply-side policies: Investment in new technology |
Policies that encourage research and development will have a short-term impact on aggregate demand, but more importantly will result in new technologies and will increase LRAS. |
|
|
Types of interventionist supply-side policies: Industrial policies |
Targeting specific industries, such as infant industries, through policies including tax cuts, tax allowances and subsidized lending promotes growth in key areas of the economy and will have a short-term impact on aggregate demand but, more importantly, will increase LRAS |
|
|
Types of interventionist supply-side policies: Investment ininfrastructure |
Increased andimproved infrastructure willhave a short-term impact onaggregate demand, but moreimportantly will increaseLRAS.
The creation of aport, for example, makes it easier for the country to import goods, which may enhance thecapital base of that country. At the same time, exports of goods will also be improved. Theexpanded market for domestic goods spurs investment to produce for overseas markets. |
|
|
Infrastructure + examples |
The building of large-scale public projects such as ports, highway systems, bridges, communications networks, as well as power and water systems |
|
|
Evaluation of interventionist supply-side policies |
- time lags - ability to create employment - ability to reduce inflationary pressure - positive impact on economic growth - negative impacton the government budget: investment in human and physical capital = expensive - positive effect on equity: Investment in human capital empowers people to better their own lives in their own way - negative effect on the environment |
|
|
Inflationary gap |
A gap that is present if equilibrium (actual) real output exceeds the level corresponding to the fullemployment level of output |
|
|
Investment |
Spending by firms on capitalgoods, for example machines, tools,equipment and factories; the change inthe stock of capital of an economy throughtime. |
|
|
Innovations |
New or improvedproducts or processes as well as newmarketing and organizational methods |
|
|
Price mechanism |
the process by which resources are allocated as prices rise or fall as aresult of changes in demand and supply. Signals and incentives are given toproducers and consumers to produce more or less or consume more or less |
|
|
Allocative Efficiency |
Refers to theefficiency with which markets are allocating resources. A market will be efficient when it isproducing the right goods for the right people at the right time. Another way of looking at it is you cannot make someone better off without making someone else worse off. |
|
|
Full employment |
A hypothetical situation in which everyone in the labor forcethat is willing to work at the market rate for his type of labor has a job |
|
|
Consumption |
Spending by individuals or households on consumer goods and services. It is thelargest component of AD |
|
|
Crowding Out |
a situation where, by borrowing money to fund its own spending, the government forcesup interest rates and thus reduces (crowds out) private sector investment |
|
|
Economies of Scale |
reduced costs per unit that arise from increased total output of a product |
|
|
Entrepreneurship |
The willingness and ability of certain individuals to organize the other three factors of production and to take risks. |
|
|
Factors of Production |
the resources needed to produce goods and services. FOP comprise of land, labour, capital and entrepreneurship |
|
|
Gini Coefficient |
a measure of inequality in the distribution of income. It is usually used in conjunction with the Lorenz Curve |
|
|
Informal markets |
Informal markets markets in which economic activity is not officially recorded (e.g. illegal black markets, barter situations….) |
|
|
Infrastructure |
essential facilities and services (e.g. roads, telecommunications), usually provided by the government, which allow economic activity to take place more easily |
|
|
Structural unemployment |
long term unemployment caused by the fall in demand for a particular type of labourfollowing a change in the structure of the economy |
|
|
Wages |
payments made to the factor of production labour |
|
|
T.I.G.E.R.S. - Macroeconomic Objectives |
Trade - balanced trade Inflation - low and stable Growth - strong and sustained Employment - low unemployment Redistribution of income Stability |
|
|
3 injections to circular flow of income |
1. Government spending 2. Exports 3. Investment |
|
|
3 leakages in circular flow of income |
1. Imports 2. Taxes 3. Saving |
|
|
2 Reasons circular flow of income may increase |
1. Increased number of households 2. Improved quantity and quality of factors of production |
|
|
Disadvantages of GDP |
- doesn't include informal markets - doesn't account for externalities e.g. environmental costs - doesn't include other aspects of quality of life - doesn't account for income inequality |
|
|
Consumers Price Index (CPI) use and calculation method |
Measurement of inflation. Calculated by: - family expenditure survey - from this, the most popular 650 goods and services are weighted by % of income spent on each item - generate index numbers using base year, tracking inflation to find the rate of change |
|
|
2 causes of inflation |
1. Demand-pull 2. Cost-push |
|
|
Causes of cost-push inflation |
- import inflation - increase in wages - increase in business taxes - increase in natural resources e.g. oil - any increase in the costs of production
|
|
|
Causes of Demand-pull inflation |
- increase in AD due to... - reduction in interest rates (more consumption) - increase in exports due to weakened currency amid fallen exchange rate - reduced taxation |
|
|
2 Causes of structural employment |
Occupational immobile - lack of skills or the correct skills that are in demand in the economy Geographically immobile - not willing or able to move to hubs of employment |
|
|
Automatic stabilizers |
Refers to theincome-induced changes of progressiveincome taxes and of unemploymentbenefits on the governments budget thattend to stabilize the business cycle |
|
|
Function of the central bank |
- set interest rates - determine and enact monetary policy - lender of last resort to commercial banks and government - issue money |
|
|
Policies to reduce cyclical unemployment |
Expansionary monetary/fiscal policy but conflicts with inflation target and it's success depends on other factors, such as consumer confidence |
|
|
Policies to reduce structural unemployment |
- implement worker training - removal of employer regulation = easier to hire and fire workers so firms are incentivised - grants and low cost houses to geographically immobile But it's expensive, time lags, opportunity cost |
|
|
Policies to reduce frictional employment |
- reduce unemployment benefits - improve job information But...no guarantee it will work, time lags, opportunity cost |