Reading...
![]()
Play button
![]()
Play button
![]()
Use LEFT and RIGHT arrow keys to navigate between flashcards;
Use UP and DOWN arrow keys to flip the card;
H to show hint;
A reads text to speech;
40 Cards in this Set
- Front
- Back
- 3rd side (hint)
|
What are scarce resources/ factors of production ?
|
Land- line natural resources
Labor- all human resources Capital - all man-made aids to production 🔹Euntrepreneurship - the ability to perceive a want and to see how resources can be used to fulfill that want |
There are 4
|
|
|
What are ulimited wants?
|
1. Goods
2. Services |
There are 2
|
|
|
What do we have to determine about or unlimited wants?
|
If they are necessities or luxuries, which depends on when (era) and where (location)
|
2 things
|
|
|
What choice do we have to make?
|
(always constant)
Can't give to someone without taking from another |
Nothing in life is free...
|
|
|
What is opportunity cost?
|
- the most desired good, service, activity that is for gone by choosing one alternative instead of another
*The forgone opportunity of the next best alternative |
It is based on choices
|
|
|
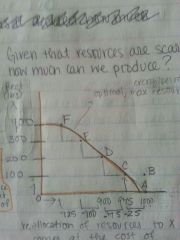
What is the production possibilities curve?
|
It shows the alternative combinations of goods and services that could be produced with all available resources and technology.
-show that given our resources that different combinations that are possible |
Given our resources, what is possible?
|
|
|
What is the law of increasing opportunity cost?
|
When more time, effort, resources are devoted to one activity,
The cost in terms of the other activity or activities sacrifice becomes greater and greater |
Greater and greater
|
|
|
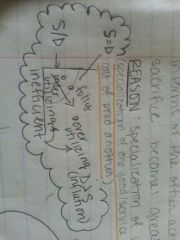
Why does the sacrifice become greater and greater (Law of increasing opportunity cost)?
|
The reason is because the specialization of inputs
↪Specialization of one good or service comes at the cost of producing another |
|
|
|
How does the production possibilities curve effect/ show opportunity cost?
|
The reallocation of resources to one good come at the cost of sacrificing resources to another service.
|
One for the other
|
|
|
How does the production possibility curve show specialization of resources?
|
High production of one good comes at the cost of low production of another
|
|
|
|
How does the production possibilities curve show the increasing opportunity cost?
|
As you produce more and more of one good the sacrifices of producing another becomes greater and greater
|
|
|
|
How can the production possibility curve increase?
|
- by growth; increasing standards of living
- so we must be able to increase our resources and technology |
2 must increase
|
|
|
What does it mean to produce on the curve, inside, and outside the curve?
|
➖ inside: under utilizing resources.
✅ on the curve: fully utilizing resources. ➕ ouside: over utilizing resources. |
|
|
|
What did Adam Smith write in his book?
|
That people who are guided by their own self interest tend to promote the greater good as well
|
|
|
|
What are the 3 alternatives for how people act?
|
1. Rely on self-interest
2. Enforce or coerced by the government 3. Rely on their benevolence |
|
|
|
What is harmony of interests?
|
Capitalists/ entreprenuers have to voluntarily "hook us up" based on their self interest.
- Responding to what customers want. |
Everybody's happy
|
|
|
What is the definition of efficient (re)allocation of resources?
|
- Prices reflect what you need
- relying on people to be frugal, mindful, get what they need. Which is guaranteed if you rely on their self interest. |
|
|
|
What is the invisible hand?
|
-Guides market assistance in the market economy.
👉⭐ prices are the reason we don't rely on a central authority, it needs to reflect reality and it tells the story of scarcity and demand. 👈 -giant billboard sign that is a market signal to businesses. |
|
|
|
What is Laissez-faire?
|
The government needs to leave (the market) alone, don't distort (the market).
|
|
|
|
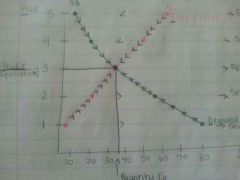
What is price determination?
|
Equal price and quantity demand/supply are determined by the interaction between the supply curve and demand curve.
|
2 curves
|
|
|
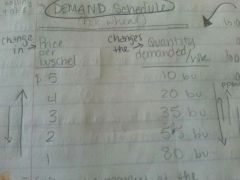
Demand schedule?
|
- explained by the law of demand.
-A Change in the price changes the quantity demand of the product per week. ⭐ it reflects the market at the time; the determinants of the demand. |
|
|
|
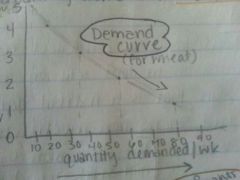
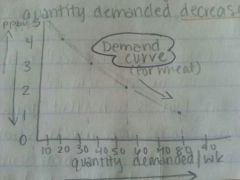
What is the law of demand?
|
- As the prices of a good decrease⬇, the quantity demanded increases ⬆.
- As the price of a good increases⬆, the quantity demanded decreases⬇. |
⬇, ⬆.
⬆, ⬇. |
|
|
What are the determinants of demands?
|
1. Income of consumers
2. Tastes of consumers (what they want) 3. Prices of related goods >substitute ($tea 🔼, Dcoffee 🔼) >compliment ($hotdog🔽,Dbuns🔼) 4. Price expectations of consumers (expect $⬆= D⬇, and the opposite) 5. Number of consumers |
They're 5.
Must keep them ceteris paribus. |
|
|
What happens with changes in demand?
|
Caused by - a change in one of the determinants of demand.
Result in - a whole new demand schedule and curve. |
A cause and effect
|
|
|
What happens with a change in quantity demanded?
|
Caused by- a change in the price of a good itself.
Results in - movement from one point to another point on the same demand curve. |
A cause and effect
|
|
|
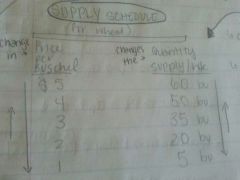
Supply schedule?
|
- a change in the price changes the quantity supplied per week.
- based on the law of supply - Reflects the market at the time and the determinants of supply. |
|
|
|
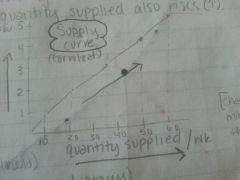
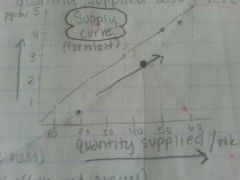
What is the law of supply?
|
As the price of a good decreases⬇, the quantity supplied also decreases⬇.
As the price of a good increases⬆, the quantity supplied also increases⬆. |
⬇, ⬇. ⬆, ⬆.
|
|
|
What are the determinants of supply?
|
1. Cost of inputs (use it for their business).
2. Prevailing technology (anything that affects production process). 3. Number of sellers 4. Price expectations of suppliers. (in the future $🔼, S🔽) 5. Subsidies and taxes 6. Price of other goods ($corn🔽, Swheat 🔽) |
There are 6.
Must keep them ceteris paribus. |
|
|
What happens with a change in supply?
|
Caused by - change in one of the determinants of supply.
Results in - a whole new supply schedule and curve. |
Cause and effect
|
|
|
What happens with the change in quantity supplied?
|
Caused by - a change in the price of the good itself.
Results in - movement from one point to another point on the same supply curve. |
A cause and effect
|
|
|
Draw a demand curve?
|
|
|
|
|
Draw a supply curve.
|
|
|
|
|
Show equilibrium price and quantity demanded/supplied.
|
|
|
|
|
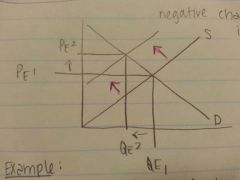
Positive change in demand? The effect?
|
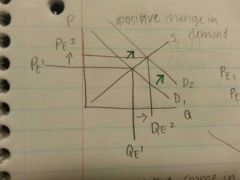
The effect: P ⬆And Q⬆
|
|
|
|
Negative change in demand? The effect?
|
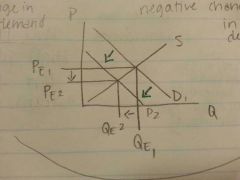
Effect: P ⬇and Q ⬇
|
|
|
|
Positive change in supply? The effect?
|
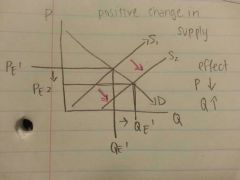
The effect : P⬇ and Q⬆
|
|
|
|
Negative change in supply? The effect?
|
The effect: P⬆ and Q⬇
|
|
|
|
Price of a demanded compliment & substitute good changes?
|
Compliment: $corn⬆, Dwheat⬆
Substitute: $ hotdogs⬇, Dbuns ⬆ |
|
|
|
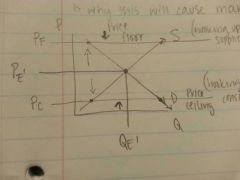
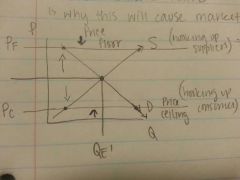
What is a price floor? Draw.
|
When the government raises the price to a certain point where it cannot fall, so it hits a floor.
-benefits the suppliers -⬆supply ⬇demand -creates a surplus -creates market failure |
|
|
|
What's a price ceiling? Draw.
|
When the government lowers the price so much that. It cannot rise anymore, hits a ceiling.
-hooking up the consumer -⬇supply.⬆demand. -creates a shortage - causes market failure |
|