![]()
![]()
![]()
Use LEFT and RIGHT arrow keys to navigate between flashcards;
Use UP and DOWN arrow keys to flip the card;
H to show hint;
A reads text to speech;
22 Cards in this Set
- Front
- Back
|
Demand Schedule |
Tabular representation of the relationship between price and quantity bought |
|
|
Demand curve |
Graphical representation of the relationship between price and quantity bought |
|
|
Law of downward sloping demand |
Other things held constant, when the price of a good is raised, consumers tend to buy less of the good |
|
|
Reasons for downward sloping demand |
Substitution effect Income effect |
|
|
Substitution effect |
When the price of good A rises, I will generally substitute goods B, C, and D for it |
|
|
Income effect |
When prices of goods go up, i find myself poorer than I was before |
|
|
Market demand curve |
The sum of all individual demands for a good Found by adding together the quantities demanded by all individuals at each price |
|
|
Forces influencing demand |
Average income Size of marketAvailability of related goods (Substitute & Complement)TastesSpecial influences (weather, seasons, etc) |
|
|
Shift in demans |
Change in qty demanded at EACH price due to a chnage in a non proce variable Change in DEMAND |
|
|
Movement along the demand curve |
Change in quantity demanded |
|
|
Supply Schedule |
Tabular representation of the relation of qty supplied of a good to its market price |
|
|
Supply curve |
Graphical representation of the relationship between the price and qty supplied of a good |
|
|
Law of diminishing returns |
used to refer to a point at which the level of profits or benefits gained is less than the amount of money or energy invested |
|
|
Factors behind supply curve |
Costs of production (technology, inputs) Prices of related goods Government policy Special influences (season, weather, innovation) |
|
|
Shift in supply |
when changes in factors other that a goods own price affect the quantity supplied |
|
|
Change in supply |
Shift of the supply curve |
|
|
Change in quantity supplied |
Movement along the supply curve |
|
|
Market Equilibrium |
The price at which quantity demanded is equal to the quantity supplied |
|
|
Equilibrium price |
Market clearing price Point where supply and demand curves intersect |
|
|
Shortage |
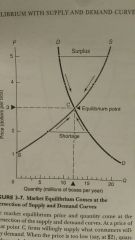
A point below the equilibrium |
|
|
Surplus |
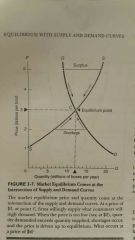
A point above the equilibrium |
|
|
Rationing by price |
By determining equilibrium prices and quantities, the market allocated scarce goods among possible uses |