Reading...
![]()
Play button
![]()
Play button
![]()
Use LEFT and RIGHT arrow keys to navigate between flashcards;
Use UP and DOWN arrow keys to flip the card;
H to show hint;
A reads text to speech;
190 Cards in this Set
- Front
- Back
|
Relationship between Growth and Trade
|
Data shows that countries that have higher growth tends to be more open to trade.
|
|
|
What do we mean by "growth" graphically?
|
The PPF grows outward/shifts to the right
|
|
|
Two kinds of causes of growth
|
1. Factors of Production
2. Technology |
|
|
Increase in Factors of Production (examples)
|
1. Growth in labor force
2. accumulation of physical capital 3. accumulation of human capital (education) 4. accumulation/new find of mineral resources |
|
|
How do changes in factor supplies affect quantities of production?
|
Rybczynski Theorem
|
|
|
Rybczynski Theorem:
|
Suppose economy's supply of capital increases (holding labor constant) then, holding relative prices constant, economy will produce more of a capital intensive good and less of the labor intensive good. {and vice versa K<-->L)
|
|
|
Rybczynski Theorem: results graphically
|
-The PPF shifts out but it is BIASED towards the capital-intensive good (if capital supply increased)
-So the input that grows at a faster rate makes the PPF shift in a biased direction toward the good that is intensive in the faster growing input. |
|
|
What are the two endpoints of the new PPF of the Rybcynski Theorem represent?
|
-given that the factor that good x is intensive in increased,
-The point at which we would only produce good y (increased very little) and if we were only producing good x (increased a lot) |
|
|
graphically, what does it mean to "hold relative prices constant"?
|
stick to the same price line; i.e. slope does not change
|
|
|
How does Growth affect Trade?
|
ex. China and U.S.
-if China's K increased, then the incentive to trade is reduced since the degree of comparative advantage is reduced; reduces import demand for capital intensive goods from U.S. which leads to a reduced production in labor intensive goods, therefore exports to U.S. is also reduced |
|
|
Effects of changes in world demand and supply of K-intensive vs. L-intensive goods...
|
work to reduce the international price of K-intensive goods relative to L-intensive goods
|
|
|
"terms of trade"
|
imports relative to exports
"improvement" and "deterioration" |
|
|
Immiserizing Growth
|
case in which extremely biased growth in direction of export good causes such a big deterioration in TOT that welfare is LOWER after growth compared to pre-growth
(graphically, relative price reduced and lower IC) |
|
|
How does trade affect growth?
|
(recently opened topic)
Trade libralization: -made firms more productive/efficient -but also caused less efficient firms to drop out of the market/exit the market |
|
|
Possible reasons for results of trade liberalization
|
1. transfer of technology
2. reverse engineering 3. better allocation of resources (i.e. higher skilled workers not working in factories) |
|
|
Rybczynski Theorem (GRAPH)
|

PPF shifts out but it is BIASED towards the capital-intensive good
|
|
|
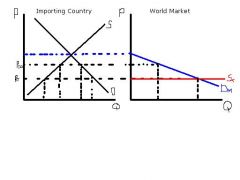
Graphs of Importing Country: Include Import Demand Curve, Free Trade, label Imports
|

Import demand curve initial price set at the equilibrium price w/o trade
|
|
|
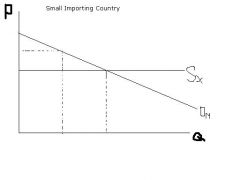
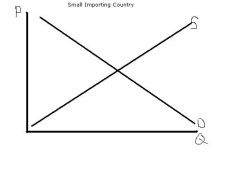
Small Importing Country: Draw Import Demand Curve and Export Supply curve
|

-export supply curve is flat because they are "price-takers"
|
|
|
Import quotas
|
a legal limitation on the quantity (value) of a good that can be imported per period of time
|
|
|
quota distorted price
|
the price at which the amount of imports demanded equals what the law says we can import
|
|
|
"quota rent"
|
monopoly profit/not a normal rate of return on investment
|
|
|
Ways to allocate licenses
|
1. Randomly give away
2. Auction off licenses (then govt gets "c") 3. Have to PROVE worthy of license (not completely all shown on graph) |
|
|
amount of import quota has to equal
|
the total # of licenses
|
|
|
Two major types of Non-Tariff Barriers
|
1. Import Quotas
2. "Voluntary" Export Restraints (VERs) |
|
|
"Voluntary" Export Restraints (VERs)
|
"voluntarily" limit how much they choose to export
|
|
|
What does VER do for competition
|
it is almost as if the competition is taken away since guaranteed market through export restrains
|
|
|
Who are the losers and winners of VERs?
|
Losers: US Consumers
Winners: US and Japanese Producers |
|
|
"Quality Upgrading"
|
-unintended effect of VER
-since limitation on quantity exported, only export highest mark-up car (with biggest profit) |
|
|
Unintended effects of VERs
|
1. Quality Upgrading
2. RENAMING of products (Playing games with categorizing things to avoid restrictions: better for U.S. consumers, worse for U.S. automakers) |
|
|
Other NTBs (Non-Tariff Barriers)
|
1. Healthy and Safety Regulations (ex. EU, US and beef; prescription drugs)
2. Red Tape (Regulations that are confusing and complicated) 3. Gov't procurement practices |
|
|
Red Tape
|
-Regulations that are confusing and complicated
1. raise cost of business transactions 2. make transactions uncertain example: France and VCRs, one port |
|
|
VER deadweight lost =
|
(1/2)*(Q imports reduced)*(increased price)
|
|
|
ad valorem
|
fixed percentage tariff rate
|
|
|
deadweight loss for ad valorem tariff
|
(1/2)*(price increase due to the tariff)*(Reduction in Q of imports)
note: price increase due to the tariff = t*Pft |
|
|
DWL as share of GDP
|
= (1/2)*(t)*(Reduction in Q of imports)*(Value of imports/GDP)
|
|
|
so how big is the DWL as share of GDP in the real world?
|
probably less than 1% of GDP...relatively small
|
|
|
"Most Favored Nation"
|
clause in WTO agreement
no country can discriminate against other countries of the WTO |
|

Complete the diagram to show an Import Quota
|

At Pqd, amount that we want to import is exactly the amount we are legally allowed to do
|
|
Complete to show the DWL due to tariff; how do we calculate the DWL
|

A = (1/2)*(Q imports reduced)*(Increased price)
|
|
|
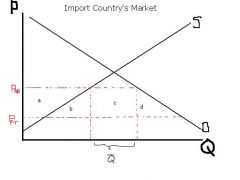
Draw a diagram to show the effects of an import quota on an import country's market like the U.S.
|
Pqd = quota distorted price
Q bar = amount of import quota |
|

What are a, b, c, d for Import Quota?
|

a = increase in producer surplus
a + b + c + d = loss of consumer surplus c = the value of the right to import the product; Quota Rent |
|

What is the relationship between "c" and Q bar?
|

total # licenses have to add up to Q bar; "c" is representative of the licenses
|
|

What is the net effect of welfare for Import Quota?
|

If all licenseholders are U.S., then the net effect of welfare is loss of b+d
|
|

What are the losses/gains if this is for Volutnary Export Restraint?
|

area c is earned by exporters
loss to consumers: a + b + c + d losers: U.S. consumers Winners: U.S. and Japanese Producers |
|

What are the implications on price with a flat Export Supply Curve?
|

If the price is less than Pft then export everything to us
If price is greater than Pft then no exports to us PRICE TAKERS |
|
|
specific tariff
|
tax levied on good PER UNIT of import
|
|
|
ad valorem
|
% value tariff
(ex. sales tax) |
|
|
Pft =
|
free trade price
|
|
|
Ptd =
|
tariff distorted price
= Pft + t |
|
|
Ptd - Pft =
|
tariff
|
|
|
How does tariff affect economic welfare? (Think only about importing country)
|
1. Higher prices --> consumers worse off
2. Higher price --> benefit Domestic Producers 3. Govt collects revenue (better off) |
|
|
Consumer surplus is
|
everything under Demand Curve but above P
|
|
|
Producer Surplus is
|
above the Supply curve but above the price line
|
|
|
To a small importing country, government revenue is
|
a GOOD thing
|
|
|
Government Revenue =
|
tariff * Quantity of Imports
|
|
|
b =
|
production effect/distortion
small since the country has a comparative DISadvantage, inefficient use of resources |
|
|
d =
|
consumption effect/distortion
represents loss to consumers who don't buy as much due to increase in price |
|
|
off-setting gain
|
where there is a loss AND a gain; i.e. comes out of consumers' pockets and into producers'/govts' pockets
|
|
|
For a small importing country, what is the effect of tariff on welfare?
|
introducing a tariff ALWAYS reduces welfare (assume everthing else is going OK in economy)
|
|
|
Difference between small importing country and large importing country?
|
upward sloping export supply curve in world market
|
|
|
Large importing country
Ptd = |
t + Pexport
(tariff + the export country price) |
|
|
How do we begin to look at tariff effects on large importing country?
|
we have to start on the right side with the world market
|
|
|
Effects of tariff on Large Importing country
|
1. higher prices --> loss to CS
2. higher prices --> gain to domestic PS 3. tax revenue --> (tariff*Q import) SAME AS SMALL IMPORTING COUNTRY |
|
|
TOT for large importing country and tariff
|
If the Price of import decreases, then TOT better
|
|
|
Show change in price in both a small importing country and world market for a tariff
|

Ptd = Pft + tariff
tariff = Ptd - Pft |
|

Describe the effects of tariff on consumer surplus of small importing country
|

loss of CS = A + B
A = loss to all consumers who were already in the market B = loss to consumers who are unable to purchase because of expensive prices |
|
Show the tariff effects on PS of small importing country
|
C + D = gain in producer surplus
C = gain to producers who had already been in market D = new producers entering market or existing producers producing more |
|

Show government revenue of tariff on small importing country
|

Government Revenue = tariff*Q of imports
|
|

Show ALL effects of tariff on small importing country -- PS, CS, revenue
|
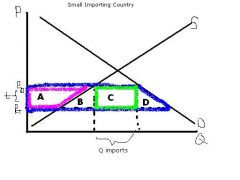
A+B+C+D= loss of CS
A=PS Gain C=govt revenue (gain) B+D = representation of loss to economy; net effect of tariff B = production effect/distortion D= consumption effect/distortion |
|
Show welfare, restricted imports and free trade imports
|

World DWL = (1/2)*(reduction in imports)*(tariff rate)
|
|
|
Draw the graphs to show a large importing country, world market, and effects of tariff
|

Ptd = t + Pexport
Pexport = the export country price Price of free trade determined by WORLD MARKET |
|

What are the gains/losses of the tariff?
|

Consumer loses: A+B+C+D
Producer gains: A Govt gains: C+E After offsets, left w/ B, D, E |
|

What are the implications of the region "E" and welfare?
|

"E" = measurement of the value of TOT improvement
If E > (B+D) then welfare increases If E < (B+D) then welfare decreases |
|
|
Show graphically the effects of tariffs on the WORLD MARKET when talking about large importing country
|
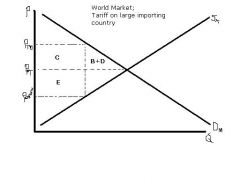
Note that the tariff is equal to Ptd-Pexport
|
|

What does each part represent?
|

C = part of tariff how much we import
E = TOT loss from exporters view; TOT gain to importing country |
|
|
What is the reason for trade?
|
Comparative advantage
|
|
|
What are two implications of comparative advantage?
|
1. trade is motivated by differences amongst countries
2. trade involves exports of some goods in return for imports of totally different goods. |
|
|
What is Interindustry trade?
|
trade that involves exports of some goods in return for imports of totally different good
(i.e. import corn, export cars. No mistake that the goods are different) |
|
|
Import demand curve is derived from
|
underlying ordinary demand curves
|
|
|
Autarky
|
situation of self-sufficiency; no trade
|
|
|
Producer Surplus?
|
return of the specialized input; (not)profit
|
|
|
Horizontal Export Supply curve represents
|
Infinitely elastic S curve
|
|
|
Draw the three graphs of the US, World and Indonesian T-shirt market with free trade
|
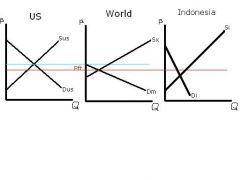
-the US equilibrium price sets the price for the Import Demand curve in the world
-Pft is below autarky for the US but above autarky for Indonesia (the export country) |
|

Show the quantity of imports at free trade
|
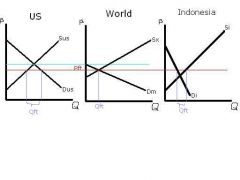
Note that Qft = imports for US and exports for Indonesia
ALL EQUAL |
|
|
(graph) show total CS with just a demand curve
What is the rltnsp between price and CS? |

If Price goes down, CS goes up
If Price goes up, CS goes down |
|

What does the height of the demand curve represent?
|
Height of Demand Curve represents marginal consumer's maximum willingness to pay
|
|
|
(Graph) Show CS with demand curve only when U.S. opens up to trade
Explain differentiation within CS |

Whole shaded in area is increase in CS
Square = Gain to consumers already in the market Triangle = gain to expanded market/market entrants |
|
|
(Graph) Show producer surplus with Supply curve only
What is the rltnsp between price and PS? |

Supply curve is the lowest acceptable price to bring quantity into the market
When Price increases, PS increases When Price decreases, PS decreases |
|
|
(Graph) Show change in producer surplus when open up to trade
Differentiation within PS |

Total shaded area equals loss of producer surplus
Square = loss to producers who remain in market triangle = loss to producers forced to exit market |
|
|
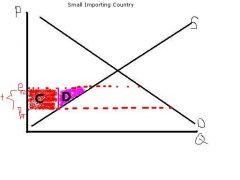
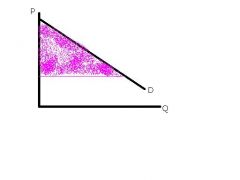
(Graph) Show change in CS and PS together for importing country and net gain from trade
|

Purple triangle area = net gain from trade (to the US)
|
|
|
(Graph) Show change in CS and PS for exporting country like Indonesia when open to free trade
|

Note that consumers lose, Producers gain
Pft ABOVE autarky |
|
|
What is General Equlibrium Analysis?
|
Looks for the equilibrium between all markets simultaneously (recognize links between markets)
|
|
|
What is Partial Equilibrium analysis?
|
ex. look at one market --> i.e. t-shirts
|
|
|
2 Assumptions for General Equilibrium Analysis
|
1. Assume 2 goods (Bread, Cheese)
2. 1 input (labor) |
|
|
Ricardian model of trade (assumptions:)
|
1. 2 goods
2. 1 input/factor of production (Others) 3. Perfect Competition 4. labor mobility between sectors 5. Assume 2 countries; labor cannot move between countries |
|

this stands for
|
= amount of labor used to produce one unit of bread
|
|
|
How do you find the total labor used to produce good B? (equation)
(Ricardian Model) |
Alb * Qb = total labor used to produce B
(Amt labor used to produce 1 unit * # units) |
|
|
How do you find the supply of labor?
(Ricardian Model) |
Alb*Qlb + Alc*Qc = L
(find the sum of total labor used to produce both goods) |
|
|
Draw a Production Possibilities Frontier for a Ricardian Model Economy
|

Note that (L/alc) derived from original formula for total labor used to produce good c
|
|
|
What does the Ricardian Model say about the wage rate?
|
It's the same in both sectors
|
|
|
Why is the wage rate the same for both sectors? (Ricardian)
|
since labor is mobile between sectors there is only one wage rate
|
|
|
Price =
|
cost per unit
|
|
|
Pb derived from (in terms of wage rate, etc)
(Ricardian) |
Pb = Alb * w (amt labor required to produce one unit * wage rate)
|
|
|
Pb/Pc =
(Ricardian) |
Alb/Alc
|
|
|
relative price =
(in rltnsp to PPF) |
absolute value of the slope of PPF
|
|
|
(Ricardian Model) Show the cycle between relative prices and Home, Foreign that lead to the situation where relative prices are the same for both countries
|

Note direction of arrows: Home has comparative advantage in bread, which is why bread is being exported from home to foreign and vice versa
|
|
|
(Graph) Show changes when opened up to trade if the new equilibrium of relative price of bread to cheese is 3
RICARDIAN MODEL |

Note that we are looking at CONSUMPTION POSSIBILITIES WITH TRADE (not production)
|
|

What will Home end up selling now?
|

HOME will sell ONLY bread because they will receive 3 cheese for every 1 Bread
end up SPECIALIZING in bread |
|
|
RICARDIAN model of comp adv: How do we justify that everyone benefits from trade?
|
since everyone is alike/the same: when one worker benefits, everyone benefits
|
|
|
RICARDIAN: what role does comp. adv. have in trade?
|
it determines WHAT we trade
|
|
|
How is "absolute advantage" reflected?
|
reflected in the WAGE RATE: HOME workers have higher wages (labor is more productive) --> higher wage but also higher productivity
|
|
|
What are the different names of the H-O model?
|
Heckscher-Ohlin Model (H-O)
Heckscher-Ohlin-Samuelson (H-O-S) 2x2x2 model Factor Endowment Model Factor Proportions Model |
|
|
Assumptions of H-O model
|
1. 2 goods (x, y)
2. 2 Factors of production (K&L) 3. 2 countries (Home, Foreign) 4. Perfect Competition 5. Factors can move btwn sectors 6. Both countries have same technology **7. Assume that preferences are the same in all countries |
|
|
Weaknesses of Ricardian model of comparative advantage
|
1. always lead to specialization
2. leads to over-specialization: (1 country, 1 good) 3. Everyone benefits from trade (there is no harm) 4. everyone is alike |
|
|
Differences between assumptions of Ricardian and H-O model
|
1. 2 factors of production (in Ricardian only 1 --> Labor)
2. H-O: Both countries have same technology; Ricardian: diff countries have diff technologies as shown by diff. labor productivity |
|
|
What does the PPF for the HO model look like?
|

"concave toward the origin"
bends toward origin Increasing opportunity cost of producing good x (the more x we produce, the more costly the opp cost is) |
|
|
Properties of concaved PPF in rltnsp with opp. cost
|
inreasing marginal cost/opportunity cost of producing good goes both ways (x, y)
|
|
|
Law of Diminishing Marginal Returns
|
Each extra unit of variable input adds less to output than the unit before it.
|
|
|
where do relatively capital-intensive/labor-intensive sectors come from?
|
using inputs (K, L) in different proportions
|
|
|
Community Indifference Curve -
|
all combinations of x & y that leave economy at same level of satisfaction/welfare
|
|
|
Properties of Indifference Curves
|
downward sloping
convex towards origin do not intersect |
|
|
State the Heckscher-Ohlin Theorem:
|
The capital abundant countries will have a comparative advantage in the capital intensive good. (The Labor abundant country has a comparative advantage in Labor Intensive good)
|
|
|
Factor-Price Equalization Theorem
|
free trade leads to the same real wage rate for labor (of a given type or skill) in different countries. Separately, it also says that free trade leads to the same real rental rate (for a given type of land) in different countries
|
|
|
Stolper-Samuelson Theorem
|
an increase in the price of the capital-intensive good relative to the price of the labor-intensive good will cause real income of capital owners to increase and real wage to fall. (LR)
|
|
|
Does the Stolper-Samuelson Theorem address short run or long run changes?
|
Long-run result: In the LR, the affect of trade on real income depends on WHO you are, not WHERE you are (also doesn't matter where you spend your income)
|
|
|
What are the 4 theorems we learned?
|
1. Ricardian Model of Comparative Advantage
2. Heckscher-Ohlin Theorem 3. Factor-Price Equalization Theorem 4. Stolper-Samuelson Theorem |
|
|
How does real income increase?
|
1. prices stay same, wage goes up
2. wage stays same, price goes down |
|
|
Is the H-O Theorem talking about LR or SR?
|
H-O theorem predicts LONG RUN results since Capital and Labor are able to move between sectors
|
|
|
In the H-O Theorem, what kinds of people are there? Who are they?
|
2 kinds of people:
1. workers - earn wages 2. capital-owners/land-owners - earn rental income |
|
|
Short run model: Specific Factors Model
|
In the short run factors are mainly tied to their initial industries, because there is limited mobility between industry. decreasing-price industry initially lose earnings (both K and L) and rising-price industry initially tend to gain earnings
|
|
|
In the Short Run, what does the impact of trade on real income depend on?
|
WHERE you work --> graphically, SR is where we didn't move on PPF
(so if you work in a sector subject to income-competition, then the income-competition will drive down your real income) |
|
|
In the Short Run, what is the impact of trade on factors employed in import competing sectors?
|
Factors employed in import competing sectors will be HARMED by an expansion of trade [i.e. lower real income]
|
|
|
In the Short Run, what is the impact of trade on factors employed in export-oriented sectors
|
they BENEFIT from an expansion of trade [trade increases real income]
|
|
|
what does the affect of trade on real income depend on in the long run?
|
In the LR, the affect of trade on real income depends on WHO you are, not WHERE you are
|
|
|
Factor-Price Equalization Theorem (in class)
|
2 countries freely trade, no barriars/no costs; THEN the wage rate for labor will be the same for all countries and the return to capital will be the same for all countries
|
|
|
What is intraindustry trade?
|
imports and exports of the same products
comparative advantage cannot explain intraindustry trade |
|
|
What is the Grubel-Lloyd index of intraindustry trade?
|

this is for one industry.
for the whole economy (group of industry) just sum up |
|
|
Looking at 1 industry, what would a GLI of 0 mean?
|
It means that there is no intraindustry trade; only interindustry trade
|
|
|
Looking at 1 industry, what would a GLI of 1 mean?
|
This means all trade in this industry is characterized as intraindustry trade
|
|
|
What is economies of scale?
|
more you produce(more output) then the average cost to produce decreases
|
|
|
What does Economies of Scale and Product Differentation lead to?
|
1. limited # locations of firms
2. diff. preferences mean that both import and export cars to fit consumers' prefs even though cost to produce are similar |
|
|
Model of Monopolistic Competition
|
1. easy entry and exit from industry
2. because product is differentiated, each FIRM faces downward-sloping demand curve (they are not a price-taker) |
|
|
In the Model of Monopolistic Competition, how sensitive is demand to price?
|
More variety of goods, the less ability to raise price w/o losing lots of customers
(assume that more varieties lead to greater competition |
|
|
What happens to the avg. cost to produce as more varieties are available?
|
1. assume total market size is fixed
2. If there are n firms, each sells to 1/n of market (all firms same size) More you sell, less AC; lsess you sell, higher AC AC INCREASES AS # FIRMS IN MARKET INCREASE |
|
|
CC curve =
|
Average cost to produce as a function of the number of firms in the market
|
|
|
PP curve =
|
profit-maximizing price curve
|
|
|
What happens when you introduce TRADE into the Model of Monopolistic Competition?
|
Market size increases by allowing trade.
CC curve shifts to the right; AC decreases |
|
|
Effects of increase in market size (total demand)
|
1. AC falls for firms
2. # firms increase 3. P, AC decrease |
|
|
Who benefits from trade in monopolistic competition?
|
Consumers: 1.) more choice 2.) lower price
Producers: Economic profits still 0, but in equilibrium each firm gets bigger and lower AC |
|
|
Model of Global Oligopoly
|
Small # firms, economic profit is possible in equilibrium
location matters for welfare (i.e. Boeing wants all econ. profits because we are Americans) |
|
|
Economies of Scale EXTERNAL to the Firm
|
doesn't matter how big the firm is, it matters how big the industry is
(i.e. computer chips, film-making) *combine with proximity --> agglomeration economies again, the location is random |
|
|
How can immiserizing growth occur?
|
Immiserizing growth can occur if growth in the country leads the country to want to trade more, and the country's terms of trade deteriorate by a large amount. If a country's trade has almost no impact on world prices, then its growth will have almost no impact on its terms of trade, and immiserizing growth is very unlikely.
|
|
|
socially optimal tariff
|
tariff rate at which social welfare is maximized; above that under both autarky and free trade
|
|
|
Prohibitive tariff
|
tariff rate at which price is so high that it prohibits/eliminates trade: welfare is same as in autarky
|
|
|
Problems with the argument FOR a tariff
|
1. we may not be a large country
2. Other countries raise tariff also, (tariff wars) volume of trade decreases |
|
|
Marginal External Benefit (MEB)
|
the additional benefits bestowed upon the economy for producing one extra good
|
|
|
infant industry argument
|
we don't have the resources to compete in larger market
|
|
|
3 types of "unfair" trade practices
|
1. unfair trade practices implemented by firms themselves
2. implemented by governments and applied to perfectly competitive industries 3. implemented by govts and applied to oligopoly |
|
|
Define "Dumping"
|
a firm that sells its product in a foreign market at an "unfairly low " price (lower than firm's domestic price, lower than AC)
|
|
|
Define an "unfairly low" price
|
1. a price lower than the price that the firm charges its own country's consumers ("international price discrimination")
2. when a firm sells its product in a foreign market at a price lower than its "full" average cost of production |
|
|
2 main motivations for dumping
|
1. Predatory Dumping
2. Persistent Dumping |
|
|
Predatory Dumping
|
a firm will take artificially low price in order to drive competitors out of the market
|
|
|
Persistent Dumping
|
international price discrimination
it is the profit maximizing thing to do demand elasticity different so charge diff. prices --> that's why its profit maximizing |
|
|
Point at which firms maximize profit:
|
when Mariginal Revenue = Marginal Cost
|
|
|
Marginal Revenue is always
|
with a slope twice as steep as demand curve
|
|
|
what does a flat MC curve mean?
|
that the extra cost of producing is ALWAYS the same
|
|
|
If MC > MR then
|
sell less
|
|
|
if MC < MR then
|
sell more
|
|
|
Two-Part Test against dumping
|
1. prove that dumping actually occuring
2. show that somehow hurting your industry |
|
|
U.S. Commerce Dept's role in two-part test
|
Finding of Fact
(almost always answers "yes" dumping occuring) |
|
|
U.S. International Trade Commission (USITC) role in two-part test
|
look to see if domestic industry is being injured by dumping (losing profit, losing employment, losing market share)
|
|
|
What are the two government depts involved in the two-part test for dumping?
|
1. U.S. Commerce Dept (fact)
2. U.S. International Trade Commission (USITC) |
|
|
Who authorizes the "Anti-Dumping Duty"
|
US Commerce Department
|
|
|
Effects of Anti-Dumping Duty (as long as not predatory behavior)
|
reduces world volume of trade
hurts U.S. consumers |
|
|
What is an export subsidy?
|
given by govt to firms
payment for the actual activity of selling your product to another country |
|
|
What is consumption distortion?
|
higher prices artificially reduce demand
|
|
|
what is production distortion?
|
higher prices artificially stimulates production more than what we have a comparative advantage in
|
|
|
Net effect of export subsidy on small country (perf. comp)
|
welfare loss
|
|
|
Net effect of export subsidy for large country
|
world price driven down due to increased exports
deterioration in TOT for exporter since price decreases DETERIORATION in export country's TOT; and net loss is even BIGGER than it would be for a small country |
|
|
Most Favored National Principle (MFN)
|
Principle of non-discrimination (countries are prohibited against discriminating each other if both members of GATT/WTO)
|
|
|
2 exceptions to MFN
|
1. industrialized developed countries are allowed to give preferential/favorable treatment to developing countries ("Generalized System of Preferences" GSP)
2. Preferential Trading Arrangements (PTA) --. Trading blocs; Free trade areas and customs Unions |
|
|
"Generalized System of Preferences" (GSP)
|
industrialized developed countries are allowed to give preferential/favorable treatment to developing countries
|
|
|
2 types of Preferential Trading Arrangements (PTA)
|
1. free trade areas (FTA)
2. customs unions (CUs) |
|
|
Difference between FTA and CU
|
FTA: Each member has independent policy towards non-members (ex. NAFTA)
CU: all members share same policy toward non-members (EU) |
|
|
Common Market
|
CU + Free mobility of productive factors
ex. EU |
|
|
Full economic union
|
Common Market + single monetary/fiscal policy, social welfare programs
ex. U.S. |
|
|
"Trade Deflection"
|
Process of trying to circumvent high tariff by going through a low-tariff FTA country
|
|
|
Trade Creation
|
creation of PTA stimulates more trade from member countries
|
|
|
Trade Diversion
|
creation of PTA changes trade pattern...substituting member country imports for non-member country
|
|
|
Conditions for when trade creation is larger than trade diversion
|
small comp. adv between suppliers
large tariff |