Reading...
![]()
Play button
![]()
Play button
![]()
Use LEFT and RIGHT arrow keys to navigate between flashcards;
Use UP and DOWN arrow keys to flip the card;
H to show hint;
A reads text to speech;
129 Cards in this Set
- Front
- Back
|
Georeferencing
|
The act of assigning information to a location
- must be both unique and persistent (no change over time) |
|
|
Types of georeferencing:
Metric |
location defined using distance referenced from fixed location (i.e, equator = 0,0)
|
|
|
Types of georeferencing:
Ordinal |
Locations ordered in some manner
- i.e, street address, postal codes |
|
|
Types of georeferencing:
Nominal |
Place names
- points, areas and lines Point = a city (small scale) Lines = a river, road Areas = cities, countries, regions (large scale) |
|
|
What is weird about the address labelling system in Japan?
|
They sometimes don't label their roads so it is hard for tourists to get around
use things like "North of X street and East of 7 street" |
|
|
Geodesy
|
measuring the size and shape of the Earth
people who did this: - Homer - Anaxamenes - Pythagoras |
|
|
T/F: The shape of the Earth resembles a sphere more than an ellipse
|
False. Earth is an ellipse (A does not equal B)
- Assumes different lengths for each axis - More appropriate since the Earth is flatter at its poles due to its rotation speed - Polar circumference = 39,939,539.9 m - Equatorial circumference = 40,075,452.7 m - Earth has a flattening index of 1/298.257 |
|
|
What is a geoid? ***
|
- Based on gravity (What would the shape of the Earth be if water could run freely across the surface?)
Earth is very irregular Not used in GIS/ cartography |
|
|
Geographic Graticule
|
- 3-D network of latitude and longitude
- "Earth as it is" - coords measured in angles |
|
|
What is a projection?
|
Process by which the Earth's spheroid is mathematically transformed onto a flat surface, either on paper or digitally
converts data sets from geographic coordinates to projected coordinates |
|
|
What are the reasons for projecting Earth onto a flat plane?
|
- easier to measure distance
- Can measure areas - can see Earth all at once - Paper used for maps is flat |
|
|
What aspects of the Earth are distorted during projection?
|
- Area
- Distance - Shape - Direction |
|
|
Mercator
|
Cyllindrical
- distorts distance and area (extreme area distortion at poles - Shrink at mid-latitudes - preserves direction and shape - Good for East-West mapping |
|
|
Robinson
|
Cyllindrical
- Distorts all four properties a little - Good for thematic mapping |
|
|
What is Tissot's Indicatrix?
|
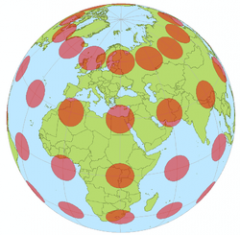
Way of gauging distortion on maps
-a single indicatrix shows distortion along the lines of latitude |
|
|
What are the three types of developable surfaces for projections?
|
Plane
Cylinder Cone |
|
|
What are the three aspects to the surface of Earth, used for projections?
|
- Normal = Oriented at polar axis, N-S direction
- Transverse = 90 deg to poles , E-W direction - Oblique= somewhere in between the two |
|
|
What is the difference between a tangent and secant projection?
|
Tangent: developable surface touches the Earth to form a tangent plane, cylinder or cone
Secant: developable surface cuts through Earth to form a secant plane, cylinder, cone - will hit two lines of latitude - reduces distortion |
|
|
Azimuthal Projection
|
Spherical surface onto a flat plane
- will preserve direction from a reference point - Resulting projection is circular in shape |
|
|
Cylindrical Projections
|
• Straight meridians and parallels
• Meridians equally spaced • Parallel spacing is the only thing that distinguished different types of cylindrical projections • Whole world maps are always rectangular • Scale true along the equator |
|
|
Conical Projections
|
****
|
|
|
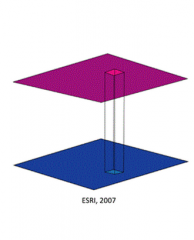
Data model
|
set of constructs for representing real world in a digital GIS environment
- geography represented as objects or fields |
|
|
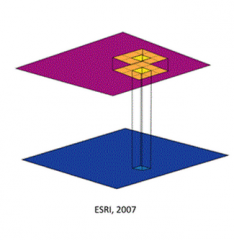
Objects
|
Well defined boundaries in otherwise empty space
- recognizable classes - Dimensionality 0- dimensional points (Property = location) 1- dimensional lines (Property= location, length) - two end points, points in between to mark shape 2- dimensional areas/ polygons (Property = area, perimeter, location) |
|
|
Fields
|
Continuous surface
- variables change value at all locations i.e, soil properties, population density, elevation |
|
|
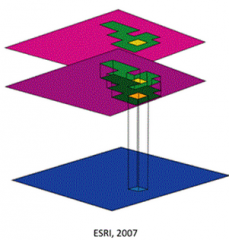
Vector Representation
|
Space defined by continuous X, Y coords
uses points, lines, and polygons to represent spatial features or object in a clear boundary - object locations defined by (x, y) pairs - coord pairs used as building blocks for lines + polygons |
|
|
Lines in Vector Representation
|
2 points define a line segment
- arc = two or more line segments - nodes = endpoints of an arc |
|
|
What is topology?
|
Concerned with the spatial relationships, not necessarily preserving direction/ distance
i.e, a subway map - Use in GIS: - to validate geometry of vector datasets (check to see if polygons closed, lines connected) - Various operations (i.e, spatial search, shortest path) Three elements: - Connectivity: arcs connect to meet each other at nodes - Containment: area defined by a series of connected nodes - Adjacency: arcs have directions and left and right polygons |
|
|
Vector Encoding
|
- Representation of vector objects in the computer
- Points, lines, polygons each encoded separately - Spaghetti Data Model o Structure simple o No relative relationships • Each feature has no knowledge of other features that it intersects or is adjacent to o Generally come from CAD files |
|
|
Raster Representation
|
Uses both a grid and grid cells to represent continuous fields such as elevation, precipitation
- each cell has a value that captures the magnitude of the field at cell location used for both fields and models Cellular organization - divides space in a series of units - each unit is same in size - Grid cells = most common raster rep. - JPEG, TIFF, GIF = formats - requires a large amount of computer memory Real world is turned into a grid Represent digital orthophotos, DEMs, categorical data, multispectral images |
|
|
Cell Values
|
Cells assigned one value only
Mixed pixel problem: How can you assign values to cells containing more than one feature? Assignment scheme: Value of a cell may be based on a domination scheme, the most common value at the edge itself. - may be the value found at the central point |
|
|
Discrete Raster
|
- values are integers
- Refers to a limited number of classes - Pixels with the same value are the same class - Similar to polygons - i.e, soil, vegetation class |
|
|
Continuous Raster
|
values are "floats"
- i.e, elevation, precipitation |
|
|
Location Precision
|
• Location not stored as X/Y
• Cell has an implied location • Only grid origin is stored • Locational precision based on cell size • Cell location refers to centre of cell |
|
|
Resolution
|
pixel size
- Size of the grid cell or picture element, defining level of spatial detail in ground units (i.e, 10 m) - pixel size = MMU = resolution - variation within pixels is lost - increase detail by decreasing pixel size - small enough grid sizes can effectively replicate vector structures Decision is based on: - level of detail required - features being mapped - map scale - storage available, machine speed There is a tradeoff between detail and storage Want to get the smallest resolution that will still allow the machine to run/ be effective 1/2 pixel width = 4x data volume |
|
|
Data compression
|
A bunch of diagrams!!
|
|
|
Quadtree data model
|
Uses cells of different sizes, depending on information density
- large cells in smooth areas, smaller ones in more detailed areas - More efficient storage than run-length coding - Display/ analysis faster |
|
|
How to build a quadtree
|
1. Divide into quadrants
2. If a quadrant is homogeneous, leave it as it is 3. If not homogeneous, subdivide until - a quadrant is homogeneous/ OR highest level of resolution is reached |
|
|
Raster vs. Vector Modelling
|
Raster strengths
- geographic position implicit - neighbouring locations represented by neighbouring cells - Accommodates both discrete and continuous data - Compatible with remotely sensed data Vector Strengths - point-line-polygon format familiar - vector systems have smaller storage requirements - individual features can be retrieved individually for processing - a variety of attributes can be associated with feature - "superior cartography" |
|
|
Rasterization
|
- vector to raster conversion
- smooth lines become jagged (lines turned into pixels) - areas smaller than the pixel size disappear - problem with mixed pixels? 1. Have vector data 2. superimpose grid surface 3. Assign definite values 4. apply "rules" 5. Reduce grid size (if applicable) |
|
|
Vectorization
|
Raster to vector conversion
- works well with discrete rasters, not so well for continuous - lines typically smoothed - Issue: where to draw the lines |
|
|
Geographic Information System
|
complex system for storing, managing, analyzing and displaying spatial data
Created in the 1960s by Roger Tomlinson |
|
|
Components of a GIS
|
- Hardware
- Software - Humans - Infrastructure |
|
|
Elements of a GIS
|
- Data model
- data acquisition - data management - data display - data exploration - data analysis |
|
|
Georelational vector data model
|
Stores geometries and attributes of spatial features seperately
|
|
|
Object based vector data model
|
Stores geometries and attributes of spatial features in a single system
|
|
|
Reprojection
|
Converts from one system of projected coordinates to another system
|
|
|
Meridians
|
Lines of equal longitude
- Prime Meridian passes through Greenwich England (0 deg) - Measure location in E-W direction |
|
|
Parallels
|
Lines of equal latitude
- Equator is 0 deg - Measure location in N-S direction |
|
|
Conformal Projection
|
preserves local angles and shapes
|
|
|
Equivalent Projection
|
represents areas in correct relative size
|
|
|
Equidistant Projection
|
maintains consistency of scale along certain lines
|
|
|
Azimuthal Projection
|
Retains certain accurate distances
|
|
|
Can a projection be both conformal and equidistant?
|
Nope, they are mutually exclusive
|
|
|
Standard Line
|
the line of tangency between the projection surface and the reference globe
- tangent = one std line - secant - two std lines Standard parallel if it follows a parallel Standard meridian if it follows a meridian |
|
|
Central Line
|
Define the centre of a map projection
- much like x and y lines on a coord grid |
|
|
False Easting
|
Assigned to x-coord
|
|
|
False Northing
|
Assigned to y coords
|
|
|
Transverse Mercator
|
Secant cylindrical
- uses std parallel - conformal Definition requires: - scale factor at central meridian - latitude of origin - longitude of central meridian - false easting, northing |
|
|
Lambert Conformal Conic
|
- conic = good for mid-lat
- greater E-W than N-S extent - secant conic Parameters: - first + second std parallels - central meridian - lat of origin - false easting, northing |
|
|
UTM Grid System
|
Earth's surface divided into 60 zones
- Each zone covers 6 deg of longitude and is numbered sequentially - |
|
|
Point
|
zero dimension (0)
- only the property of location |
|
|
What are the advantages of topology?
|
- Ensures data quality and integrity
- Can enhance GIS analysis |
|
|
Shapefile
What are the main advantages of shapefiles? |
standard non topological data format in ESRI products
.shp file stores geometry .shx file maintains spatial index of feature geometry Advantages - can display more rapidly on monitor than topology data -non proprietary, interoperable (can be used across different software packages) |
|
|
Association
|
defines how many instances of one class can be associated with another class through multiplicity expressions at both ends of the relationship
|
|
|
Aggregation
|
describes the whole-part relationship between classes
- a type of association, except that the multiplicity at the composite (whole) end is 1 - multiplicity at the other end is 0 or a positive integer - a census tract is an aggregation of a number of census blocks |
|
|
Composition
|
describes a type of association in which the parts cannot exist independantly from the whole
- ex: roadside rest areas along a highway cannot exist without a highway |
|
|
Type inheritance
|
defines the relationship between a superclass and subclass
subclass: member of a superclass and inherits its properties and methods Ex: a residential area is a member of a built up area but it can have properties such as lot size that seperate residential areas from commercial or indiustrial |
|
|
Triangulated irregular network (TIN)
|
approximates the terrain with a set of nonoverlapping triangles
- each triangle assumes a constant gradient - flat areas have fewer but larger triangles - highly variable areas have denser but smaller triangles Commonly used for terrain mapping and analysis - point, line, polygon features |
|
|
What are the two general forms of data capture in a GIS?
What is an example for each in a raster + vector GIS? |
1. Primary:
- Raster (Remote sensing, aerial photog) - Vector (GPS, VGI, Surveying) 2. Secondary - Raster (Scanning maps, DEMs from maps) - Vector (Digitizing maps) |
|
|
Remote sensing/ aerial photography
|
- Collect data about Earth's surface without touching anything
- Info derived from measurements of electromagnetic radiation - Resolution is a key factor (Spatial, temporal, spectral) |
|
|
What is secondary raster capture?
What are three reasons why its useful? |
- Scanning of maps, aerial photos, ect
1. Reduce wear + tear, improve access 2. Provide geographic context for other layers 3. Backdrops for onscreen digitizing |
|
|
What are procedures/ reasons for georeferencing a raster?
|
- Define existence in physical space
- Establish a relationship between raster + vector data and projections + coordinate systems - Align raster with control points |
|
|
How do you align a raster with control points?
|
1. Match raster to vector data with known coordinate system
2. Add spatially referenced data to the frame first 3. Identify ground control points that link locations in each data set (best with known/ obvious features) 4. Try to put points at corners 5. As you place each point down the raster the image will shift |
|
|
What is RMS error?
|
- Difference between the "from" control point to the corresponding "to" control point after transformation
- describes how consistent the transformation is between the different control points - Large errors can be removed |
|
|
What is the difference between updating and rectifying a georeferenced image?
|
Updating: Produces a "word file"/ updates "on the fly" (doesn't actually save anything)
Rectify: Produces a new raster dataset that is georeferenced |
|
|
On-screen digitizing
|
- Primary input device is the mouse
- continuously sends a set of X,Y coords to computer |
|
|
Manual digitizing: Tables and Tablets
|
- Lay map on table?
- Table has built-in electronic mesh (spacing determines amount of resolution) |
|
|
Manual digitizing: Digitizing puck
|
- Mouse like device, transmits the location of a point to the controller
|
|
|
Some rules to follow when digitizing
|
1. Digitize what you really need
2. Use the best level of accuracy according to your task 3. Input data as separate themes (point, line, polygon) 4. Choosing the right amount of points is difficult, use common sense |
|
|
What is "snapping" in georeferencing?
|
Snapping automatically connects features
- prevents dangles - features falling within snap distance are automatically connected 1. Edge snapping 2. End snapping 3. Vertex snapping |
|
|
Primary vector capture: Surveying
|
- Locations of objects determined with angle + distance measurements from known locations
- Uses field equipment + ppl - Most accurate for large + small scale area |
|
|
Primary vector capture: Global Navigation Satellite Systems
|
GPS(NAVSTAR)–developed by US army
GLONASS–developed by Soviet Union GALILEO–currently being developed by European Union COMPASS–currently being developed by China |
|
|
How does environment impact accuracy?
|
1. Signal blockages
- Common in valleys - Caused by regional topography - Related to satellite constellation 2. Signal interference - common on engineering sites - caused by electric noise - often the result of microwave antennas 3. Signal Obstructions - Common under dense canopies - Caused by vegetation, buildings - Results in multipath signals (more than one signal trying to get from the satellite to you) |
|
|
What is VGI?
|
Volunteered Geographic Information
- Citizens volunteer to contribute to geographic data - can be good in catastrophic situations |
|
|
Levels of measurement: Nominal
|
- Simplest form of measurement
- Placing observations into one of two mutually exclusive categories - Only want to know if values are the same or different - a=b, a does not = b Examples: - Land use categories - Ecozones |
|
|
Level of measurement: Ordinal
|
- Objects are placed in some rank order (1,2,3, high, medium, low)
- Order is meaningful but magnitudes are not Example: - average age at death |
|
|
Level of measurement: Interval
|
- Objects are ordered
- Magnitude between objects is meaninful - 0 is meaningful Examples: Temperature |
|
|
Level of measurement: Ratio
|
Objects are ordered
- magnitude between objects is meaningful - how many times one object varies from another - a/b - 0 means an absence of data Examples: - Hamilton municipal election percentage |
|
|
Sources of tables
|
dBASE files
INFO files Excel spreadsheets Microsoft access ASCII text files |
|
|
Feature attribute table
|
- Stores attributes of map layer
- Has special fields for spatial information |
|
|
Standalone table
|
- Stores any tabular data
- NOT associated with spatial data - OID instead of FID |
|
|
What are the 3 field properties?
|
1. Length: the total characters a text file can store
2. Precision: The total number of digits a numerical scale can store 3. Scale: The number of decimal places |
|
|
What are naming rules for data types? (dBASE files)
|
- No more than 10 characters for dBASE (shapefiles)
- Use only letters, numbers - Must start with a letter, no spaces - Must be unique within table |
|
|
Types of Data:
- Short - Long - Float - Double - Text - BLOB |
Short: Integers stored as 4 byte binary numbers
Long: Integers stored as 10 byte binary numbers Float: floating point values (1.29987) Double: Text: Alphanumeric strings Date: Date format BLOB: Binary large object |
|
|
Relational Model
|
- Each column or field represents an attribute
- Each row of attribute values represents a tuple - Table is called a relation and is: - Composed of a set of tuples - Each tuple occurs only once - tables connected by "keys" |
|
|
Primary Key vs. Foreign Key
|
Primary Key: One or more attributes whose values uniquely identify a tuple
Foreign Key: one or more attributes in a relation which identify the primary key in another relation |
|
|
Types of relationships:
One-to-One One-to-Many Many-to-Many |
One-to-One
- One tuple in Table A is related to one tuple in Table B and vice versa - Provinces to Premiers - Principals to schools One-to-Many - a tuple in Table A is related to many tuples in Table B (a tuple in Table B is only related to one tuple in Table A) - Provinces to cities Many-to-Many - a tuple in Table A can be related to many tuples in in Table B and a tuple in Table B can be related to many tuples in Table A - students to class - stores to customers |
|
|
What are the two basic types of maps?
|
- General reference (road maps, topo maps)
- Thematic (land use types, biomes) |
|
|
What are some examples of nominal point data?
|
- Types of buildings, types of settlements
- Symbolization must be legible + distinctive |
|
|
What are some examples of nominal line data?
|
- Political boundaries, roads, rivers
- Symbolization distinguished by character of lines (colour, bolded, dashed) |
|
|
What are some examples of nominal area data?
|
- Land use, geologic formations, vegetation
- Symbolization - Distinctive colours - Patterns often good choices |
|
|
What are some examples of ordinal point data?
|
- Size of settlements
- Proportion of French speakers Symbolization: -Intensity best distinguished by shading - Size/ amount best distinguished by size of circle |
|
|
What are some examples of ordinal line data?
|
Roadway congestion
Political boundaries |
|
|
What are some examples of ordinal area data?
|
Suitability of soils for a certain crop
- major vs minor manufacturing areas Symbolization: |
|
|
Discrete vs. continuous phenomena
|
Continuous: temperature, precipitation, elevation
Discontinuous: populations of settlements |
|
|
Continuous
|
- Assumes a gradual change between sample points
Symbolization - based on contours - Process of drawing isolines is "interpolation" RULES FOR ISOLINES - never split/ bifurcate - extreme lows/ highs symbolized by pair of isolines |
|
|
Cartograms
|
- Data areas are made proportional to the values being mapped
- Areas scaled + used as symbols - like a homunculus |
|
|
Dot maps
|
- dots are placed at points to represent numbers of phenomena being mapped
-investigate factors that control distribution |
|
|
Chloropleth maps
|
Conventional for density/ ratio data
- Sequence of shades - Shades assigned to value classes |
|
|
What are the two approaches to standardizing data?
|
1. Rate (i.e, cancer death rate/1000 ppl)
2. Proportion/ percentage (i.e, population change) |
|
|
What are the first five (of seven) types of classification methods?
|
1. Equal interval
- Data split into equal number of classes - does not consider underlying distribution - calculated as range/# of classes 2. Defined interval (specify interval size) - Specify interval size - Number of classes will be determined based on interval size + range values 3. Quantile/ percentile - Data rank ordered + equal # of observations placed in each class - identical data should not be placed in different classes - Calculated as total observation/# of classes 4. Natural breaks - Minimize difference between data values - Computed via algorithms - Considers underlying values of data 5. Geometric progression - classes are created so that interval width increases at a multiplicative rate - Considers the underlying distribution of data - Example: if the first class is 2 units wide, the next would be 4 (2 × 2), then 8 (2 × 2 × 2), and so on... |
|
|
What are the last two (of seven) types of classification methods?
|
6. Arithmetic progression
- Classes are created so that the interval width Example: if the first class is 2 units wide, the next would be 4 (2 + 2), then 6 (2 + 2 + 2), and so on... 7. Standard deviation Classes are created by adding or subtracting standard deviations from the mean of the data - Effectively creates bipolar data (values are compared to the mean) - Considers the underlying distribution of the data |
|
|
Rules of Classification
|
Number of classes = no more than 11, no less than 4
- Include all data values - no overlapping classes - classes should capture underlying distribution - Maximize differences between classes - Minimize differences within classes |
|
|
When is a serif font acceptable in a map?
When is a sans-serif font acceptable in a map? |
Serif:
Physical features oceans + lakes (ALL CAPS AND ITALICS) Rivs Sans serif: cultural features |
|
|
Scale
|
a statement of how distance on a map relates to distance on the ground
- should always use round numbers - usually at bottom Verbal statement Representative Fraction Graphic Scale |
|
|
Local Functions
|
Create an output layer where each cell value is a function of the same cell from the input layer
For example: output cells are directly related to input cells |
|
|
Focal/ Neighbourhood Function
|
Create an output later where the value of the cell is a function of its neighbouring cells on the input
- often used for spatial aggregation, slope, aspect The neighbourhood is defined by a window that is moved over input layer cells - 3x3 cells is a common window size |
|
|
Spatial Aggregation
|
down sample a large raster layer to reduce it to a smaller number of cells
- As window size increases, detail is lost |
|
|
Averaging Method
|
Computes the average value of all cells over window + uses as the value of aggregated cell
|
|
|
Central Cell Method
|
Uses the central cell in the window as the aggregated value
|
|
|
Median Method
|
Computes median value of all cells + uses as aggregated
|
|
|
Zonal Focus
|
Create an output layer where the value of the cell intersects of falls within the input zone layer
The zone = all of the areas with the same value - used for parceling, zonal statistics |
|
|
Parceling
|
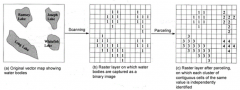
Identifies clusters of spatially contiguous cells with the same values + reclassifies then by giving each cluster a unique value
|
|
|
Category-wide Overlay
|
Goal is to obtain relevant data for computing statistics (totals, averages, ect)
- two input layers to create one output - Use cells on one raster as a "cookie cutter" to extract values from others |
|
|
Distance functions
|
Used to measure distance from source cells
Used for: - Proximity - Straight line distance - cost-weighted distance - shortest path calculations |
|
|
What are the 5 M's of GIS
|
Mapping
Measurement Monitoring Modelling Management |
|
|
Datum
|
Defines the position of the ellipsoid relative to the centre of the Earth
- Defines how the graticule is seated over the ellipsoid - Both a datum + ellipsoid are needed to define a Geographic Coordinate System |
|
|
What are the four components of a Geographic Coordinate System ?
|
- Datum
- Spheroid - Prime Meridian - Unit of Measure |
|
|
Albers Equal Area Projection
|
- Poles not represented as points but as arcs (meridians do not converge)
- Latitude lines unequally spaced concentric circles |