Reading...
![]()
Play button
![]()
Play button
![]()
Use LEFT and RIGHT arrow keys to navigate between flashcards;
Use UP and DOWN arrow keys to flip the card;
H to show hint;
A reads text to speech;
20 Cards in this Set
- Front
- Back
|
What is mean?
|
Mean is the average between a set of data points.
|
|
|
How do you find mean?
|
Add everything together and then divide by the number of data points.
|
|
|
What is median?
|
Median is the middle number between the data points.
|
|
|
How do you find median?
|
You put the data points in order from least to greatest and then you start crossing out numbers from each side until you reach the middle number.
|
|
|
What is mode?
|
The number that occurs the most in the data set.
|
|
|
How do you find mode?
|
Look at the data set and see what number occurs the most.
|
|
|
What is range?
|
Range is the difference between the greatest and the least data values for a set of data.
|
|
|
How do you find range?
|
You find range by getting the smallest and the largest data points and subtracting them.
|
|
|
What is minimum?
|
Minimum is the lowest number in the data set.
|
|
|
What is maximum?
|
Maximum is the largest number in a data set.
|
|
|
What does LQ sand for?
|
LQ sands for lower quartile.
|
|
|
What does UQ sand for?
|
UQ sands for upper quartile.
|
|
|
What is an outlier?
|
Outlier is a data value that is much higher or lower than the other data values in the set.
|
|
|
What does IQR sand for?
|
IQR sands for Inter Quartile Range.
|
|
|
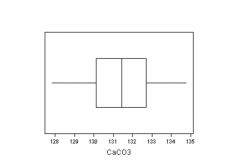
What does a box plot look like?
|
|
|
|
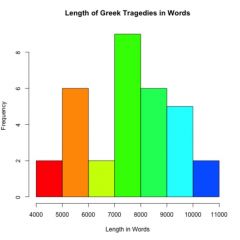
What is a histogram?
|
It's bar represents an interval instead of a different category like a bar graph.
|
|
|
What does a histogram look like?
|
|
|
|
What is LQ, UQ, minimum, maximum, and median?
|
They are all called a 5 number summary together.
|
|
|
What are intervals?
|
Intervals can be a multiple of numbers in a bar on a histogram.
|
|
|
What does a box plot have?
|
A box plot has the 5 number summary.
|