![]()
![]()
![]()
Use LEFT and RIGHT arrow keys to navigate between flashcards;
Use UP and DOWN arrow keys to flip the card;
H to show hint;
A reads text to speech;
189 Cards in this Set
- Front
- Back
|
Doppler Effect |
- Sound wave reflected from a moving object changes it's frequency proportional to the velocity of the object. - The change in frequency of ultrasound scattered from a moving target. |
|
|
Purpose of the Doppler Effect |
Used to calculate velocity of red blood cells in relation to the observer. |
|
|
Doppler Equation |
v= c× ∆ F/ [ 2Ft (cos )] C =speed of sound in blood (1540 m/sec) Cos = angle between the ultrasound beam and direction of blood flow Ft = transmitted frequency Fs =scattered signal receivedback at the transducer V =velocity of flow (m/sec) ∆ F: change in frequency |
|
|
Doppler Shift |
- Change of frequency in backscattered signals from small moving objects. - Equation:∆F= (Fs –Ft ) - Either positive, negative, or zero |
|
|
Positive Doppler Shift |
- Displayed above baseline - Received freq. > transmitted freq. - Red - Towards transducer |
|
|
Negative Doppler Shift |
- Displayed below baseline - Received freq. < transmitted freq. - Blue - Away from transducer |
|
|
Zero Doppler Shift |
RBC's stationary compared to transducer. |
|
|
Doppler Tells Us: |
- Absence or presence of blood flow - Flow direction - Flow velocity - Flow characteristics |
|
|
Doppler Equation Definition |
- The relationship between doppler shift and the velocity of blood flow - The machine calculates velocity of blood flow by using the doppler equation |
|
|
The Doppler equation is dependent on what 3 factors? |
- Frequency of transducer - Velocity of blood - Intercept angle between direction of blood flow and US beam |
|
|
Doppler Shift in relation to Velocity |
Directly related |
|
|
Doppler Shift in relation to Transducer Frequency |
Directly related |
|
|
Doppler Shift in relation to Cosine Angle |
Directly related |
|
|
Doppler Shift in relation to Speed of Sound (in medium) |
Indirectly related |
|
|
Velocity |
- Magnitude AND direction - Doppler frequency depends on direction |
|
|
Cosine of 0 or 180 Degrees |
- Equals 1 - Positive or negative doppler shift - Parallel to flow |
|
|
Cosine of 0 or 90 Degrees |
- Equals 0 - No doppler shift - Perpendicular to flow |
|
|
Spectral Analysis: Autocorrelation |
- Digital technique used to analyze color flow doppler |
|
|
Spectral Analysis: Fast Fourier Transform |
- Digital technique used to process both PW and CW Doppler - Spectral display of FFT distinguishes laminar flow from turbulent flow |
|
|
Pulsed Wave Doppler |
- Allows sampling of blood flow velocities with use of sample volume from specific intracardiac depth - Uses one crystal - Has range resolution (can localize and analyze flow at a certain location) |
|
|
Pulse Repetition Frequency (PRF) |
- # of pulses created by the system in one second - Can change it by changing the depth - Depth and PRF are inversely related |
|
|
What does the frequency shift of PW doppler indicate? |
The direction and velocity of the object. |
|
|
What is the maximum velocity that PW doppler can measure? |
It cannot resolve velocities >1 m/sec, and cannot measure maximum velocities |
|
|
Sample Volume |
- Small region where PW doppler velocity is measured. - Sampling or listening occurs within sample volume (gate size) - Normal SV range: 5-7 mm, 1-2 is recommended |
|
|
Modal |
Black in the middle (on PW doppler) |
|
|
Spectral Doppler Display Provides |
- Velocity at SINGLE SPOT by placing SV at certain location - Superior temporal resolution (determined by frame rate--high frame rate=better temp. res.) - Timing and velocity of sample volume are accurately detected |
|
|
Nyquist Limit |
- Defined as the highest Doppler frequency of velocity that can be measured without the appearance of aliasing (signal wrap around) - NL (Hz) = 1/2 PRF or PRF/2 - PW Doppler cannot resolve velocities above the Nyquist Limit |
|
|
Signal Aliasing |
- Doppler frequency or velocity that is above - Occurs when velocity > Nyquist Limit |
|
|
How to Eliminate Aliasing |
1. Move baseline 2. Move scale (increase) 3. Increase PRF 4. Use lower frequency transducer 5. Use CW instead |
|
|
High PRF |
- Use of more than one sample volume at different depths along US beam - Can sample higher velocities than PW - Different than CW (uses sample volume) - Cannot determine exact location due to 1+ SV's |
|
|
Color Flow Doppler |
- Color Flow superimposed on 2D image - Decreases frame rate and temporal resolution - Has range resolution - Has aliasing |
|
|
Color Flow Doppler provides information on what? Disadvantages? |
- Direction of jet - Extent of jet - Mean velocities - Detects additional jets (multiple regurgitant jets) Disadvantages: slow frame rate, limited temporal resolution |
|
|
How to optimize frame rate with color doppler? |
- Small color box - Decrease depth - Decrease sector size - Decrease the number of bursts from 8 to 4 |
|
|
What color is turbulent flow? |
Green or mosaic |
|
|
Continuous Wave Doppler |
- Can use guided or non-guided probe (2D probe or pedoff probe) - Uses 2 crystals |
|
|
Advantages/Disadvantages of CW |
Advantages: - Evaluate high velocities accurately Disadvantages: - Unable to know the exact location (no range resolution) |
|
|
Pedoff vs. 2D Probe |
Pedoff: non-imaging, only used for CW, small footprint, steerable 2D: large footprint, can follow image rather than blood flow, steerable |
|
|
PW vs. CW |
PW: uses SV to determine velocity at specific point, limited ability to resolve high velocity, can be displayed as color flow or spectral envelope CW: cannot resolve location of velocity, can resolve any physiologic velocity, can only be displayed as spectral envelope |
|
|
Side Lobes |
Extra acoustic energy created by single crystal transducers |
|
|
Grating Lobes |
Extra acoustic energy created by array transducers |
|
|
How to adjust if you are seeing a mirror image? |
- Adjust focal zone or TGC at level of diaphragm - Scan from multiple windows |
|
|
Hemodynamics/Pressure-Flow Relationship |
- Hemodynamics: principles of blood flow circulation - Driving force behind fluid flow - Pressure difference necessary for fluid flow - Flow occurs from HIGH to LOW pressure |
|
|
Pulsatile Flow |
- Arterial - Cardiac contraction - High rate - Higher pressure |
|
|
Phasic Flow |
- Venous - Respiration - Low rate - Lower pressure |
|
|
Properties of Blood |
- Density: mass of blood per unit volume, measure resistance to acceleration, the greater the mass-the more resistance to flow - Viscosity: (gooeyness) resistance of flow by fluid in motion, physical parameter that characterizes fluid's ability to resist change in it's shape, may vary with temperature |
|
|
What are the factors that control flow of fluids within a tube? |
- Pressure gradient - Radius of tube - Length of tube - Viscosity of fluid (higher RBC concentration=higher viscosity) |
|
|
Poiseuille's Law |
- Flow = Pressure/Resistance - Flow increases when pressure increases - Flow increases when resistance decreases |
|
|
Reynold's Number |
- Distinguishes between laminar and turbulent flow - No unit - Re > 2100 = turbulent flow - Re < 2100 = laminar flow |
|
|
The point where turbulence occurs depends on: |
- Velocity - Viscosity - Density - Radius of vessel |
|
|
What factor most determines whether turbulence will occur or not? Why? |
If vessel size or velocity of blood increases, because viscosity and density of blood is fairly consistent. |
|
|
Determinants of Flow Velocity Profiles |
- Accelerated flow - Curvature of vessel - Branching to smaller vessels - Obstructed vessel - Diverging cross section |
|
|
Types of Flow Velocity Profiles |
- Laminar flow: normal, speed highest at center - Turbulent flow: unpredictable, coherence of velocities across lumen is lost - Asymmetric flow: occurs when blood flows around a bend in vessel |
|
|
Asymmetric flow details |
- Faster on inside of curve when ascending - Faster on outside of curve when descending |
|
|
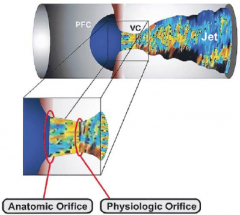
Flow through a small orifice can be characterized by what three things? |
- Proximal flow convergence - Vena contracta - Flow disturbance/turbulence |
|
|
Small orifice blood flow picture
|
|
|
|
Bernoulli's Equation (simplified) |
PressureGradient =4V^2 - Measured in mmHg - P = change in pressure(instantaneous pressure gradient) - V = instantaneous velocity (m/s) - Converts velocity to pressure and calculates pressure difference |
|
|
How is Bernoulli's equation applied in echo? |
- Enables estimation of pressures within cavities and across the valves - Important in grading degree of valvular stenosis, left atrial pressure, left ventricular filling pressure, right ventricular systolic pressure, etc. |
|
|
Stroke Volume Formula |
- SV = CSA * VTI •SV = stroke volume •CSA = cross sectional area--0.785 x (LVOT diam)² •VTI: Velocity Time Integral Stroke volume is the volume of blood ejected per beat. |
|
|
Bernoulli's Principle |
At the most narrowed location: - Velocity is the highest - Kinetic energy is the highest - Pressure energy is the highest - Due to the law of conservation of energy pressure energy decreases as kinetic energy increases |
|
|
Gorlin Equation |
- Also called continuity equation - Flow before = flow after - "What goes in must come out" - Flow across a fixed orifice is: flow rate = CSA * flow velocity - Flow across AV is: SV = CSA * TVI |
|
|
Why is cath lab gradient (using bernoulli equation) lower than echo? How did echo fix that? |
Because cath lab measures peak to peak gradient, where echo measure instantaneous gradient. Echo now measures the mean gradient. |
|
|
High velocities relate to a _________ in pressure. |
Drop |
|
|
At any area of significant narrowing in flow stream, flow velocity ___________ in relation to degree of narrowing. |
Increases |
|
|
Antegrade and Retrograde Flow |
Antegrade: forward flow, normal Retrograde: regurgitant flow, backward flow |
|
|
Normal Flow of Aortic Valve |
PLAX: Antegrade flow is red during systole, and displayed above the baseline. Apical 5: Antegrade flow is blue during systole, and displayed below the baseline. |
|
|
Normal Flow of Mitral Valve |
Apical 4: Antegrade flow is red during diastole, and displayed above the baseline. Apical 4: Regurgitant flow will be blue during systole and displayed above the below the baseline. |
|
|
Normal Flow of Tricuspid Valve |
Apical 4: Antegrade flow is red during diastole, and displayed above the baseline. Apical 4: Regurgitant flow will be blue during systole and displayed above the below the baseline. |
|
|
Normal Flow of Pulmonary Valve |
ASAX: Antegrade flow is blue during systole, and displayed below the baseline. ASAX: Regurgitant flow is red during diastole, and displayed above the baseline. |
|
|
Normal Flow of the Pulmonary Vein/LA Filling |
Apical 2/4: Antegrade flow is red and retrograde flow is blue. 3 peaks on spectral display: 2 above (1-systole and 1-diastole) and 1 below (late diastole) |
|
|
Normal Flow of Hepatic/SVC/RA Filling |
SC/SSN: Antegrade flow will be blue throughout and below the baseline. |
|
|
Normal Flow of Descending Aorta: |
SSN: Antegrade flow will be blue during systole and red during diastole. |
|
|
Normal Flow of Abdominal Aorta: |
SC: Antegrade flow will be red during systole. Retrograde flow will be blue during diastole. |
|
|
Normal PV (RVOT) peak velocity |
0.6-0.9 m/sec |
|
|
Normal peak LVOT velocity: |
0.7-1.1 m/s |
|
|
Normal peak AV velocity: |
1.0-1.7 m/s |
|
|
LVIF (MV inflow) Normal E and A point velocities |
E: 0.6-1.3 m/sec A: 0.2-0.4 m/sec |
|
|
Normal peak velocity for MR |
4.0-6.0 m/sec |
|
|
RVIF (TV inflow) Normal E and A point velocities |
E: 0.3-0.7 m/sec A: 0.2-0.4 m/sec |
|
|
Normal RVSP (right ventricular systolic pressure) |
15-30 mmHg |
|
|
Normal PAEDP (pulmonary artery end diastolic pressure) |
4-12 mmHg |
|
|
Normal velocities RVOT and PV/MPA |
0.6-0.9 m/sec |
|
|
IVS Thickness (diastole)
|
0.6 – 1.1 cm
|
|
|
LV Size (diastole)
|
3.7 – 5.6 cm
|
|
|
LV Posterior Wall (diastole)
|
0.6 – 1.1 cm
|
|
|
LV Size (systole)
|
2.0 – 3.8 cm
|
|
|
LVOT Diameter
|
1.8 – 2.4 cm
|
|
|
Sinus of Valsalva
|
2.1 – 3.5 cm
|
|
|
Sinotubular Junction
|
1.7 – 3.4 cm
|
|
|
Mid–ascending Aorta
|
2.1 – 3.4 cm
|
|
|
Ejection Fraction
|
55–75%
normal: 50–70 mildly reduced: 40–50 moderately reduced: 30–40 severely reduced: <30 |
|
|
All M–mode measurements are leading edge to leading edge except for _________?
|
Left atrial size
|
|
|
LVOT TVI |
18-22 cm |
|
|
LA size (Women and Men) |
Women: 2.7-3.8 cm Men: 3.0-4.0 cm |
|
|
SV (Mayo and Reynolds) |
Mayo: 50-90 cc Reynolds: 70-100 cc |
|
|
CO (Mayo and Reynolds) |
Mayo: 4-7 L/min Reynolds: 4-8 L/min |
|
|
CI |
2.5-4.5 L/min/m^2 |
|
|
LA Volume Index |
Normal: 22 (+/- 6 cc/m^2) cc/m^2 Mild: 28-33 (+1 SD) cc/m^2 Moderate: 34-39 (+2 SD) cc/m^2 Severe: 40+ (+3 SD) cc/m^2 |
|
|
Stroke Volume (cc) |
SV = LVOT diameter ^2 *0.785 * LVOT TVI SV = EDV-ESV |
|
|
Cardiac Output (L/min) |
CO = SV * HR |
|
|
Cardiac Index (L/min/m^2) |
CI = CO/BSA |
|
|
LA Volume (cc) |
LA Vol = [0.85 * LAA4C * LAA2C]/LADs |
|
|
Systolic Function Definiton
|
Tells us how well the ventricle is contracting.
|
|
|
What can systolic function evaluation tell us?
|
Predictor of the outcome of:
– Ischemic heart disease – Cardiomyopathies – Valvular heart disease – Congenital heart disease |
|
|
Mechanical Systole
|
Segment of cardiac cycle from Mitral Valve closure to Aortic Valve closure.
MV closure to AV closure |
|
|
Electrical Systole
|
Segment of EKG from the onset of QRS to the end of the T wave
Beginning Q to the end of T Ventricular depolarization through repolarization |
|
|
When does systole begin?
|
When the LV pressure exceeds LA pressure, resulting in closure of the MV.
|
|
|
When does systole end?
|
At the dicrotic notch when the aortic pressure exceeds LV pressure, resulting in closure of the AV.
|
|
|
Systole (Mechanical/Electrical)
|
MV closure to AV closure
Start of QRS to end of T Includes isovolumic contraction and ventricular ejection. |
|
|
Volume changes during systole:
|
– LV is at it's maximum volume at the onset of systole (end diastole)
– LV is at it's minimum volume at the end of systole (end systole). |
|
|
Early Systole:
|
LV pressure > LA pressure
– causes MV to close – MVC followed by IVCT IVCT – LV pressure rapidly rising, but volume is constant |
|
|
Mid Systole:
|
Pressure crossover in mid–systole
– When MV pressure > Aortic pressure – Causes AV to open |
|
|
Late Systole:
|
Aortic pressure > LV pressure
– LV is still emptying but at a slower rate Aortic Valve closure – Represented by dicrotic notch on aortic pressure tracing – Immediately after LVET |
|
|
Stroke Volume Definition
|
Pump performance of the heart.
(a way to measure systolic function) |
|
|
Ejection Fraction Definition
|
Decrease in chamber volume relative to end–diastolic volume.
(a way to measure systolic function) |
|
|
Stroke Volume and Ejection Fraction depend on:
|
1. Contractility
2. Preload 3. Afterload 4. Ventricular geometry |
|
|
Contractility
|
Intrinsic ability of the myocardium to contract independent of loading conditions or geometry.
Affected by: 1. Heart rate 2. Coupling interval 3. Metabolic factors 4. Disease processes 5. Pharmacologic agents |
|
|
Preload
|
– Initial ventricular volume or pressure
– Initial stretching of cardiac myocytes prior to contraction – Affected by venous BP and rate of venous return – Increase in end–diastolic volume = increase preload |
|
|
Frank Starling's Law
|
Stroke volume increases in response to increase in volume of blood filling heart when all other factors remain constant.
Greater initial stretch = Greater force of contraction *too much of an increase affects the heart adversely as well (too much stretching and it loses ability to go back to original size). |
|
|
Afterload
|
Aortic resistance or end systolic wall stress
Increase afterload = Increase BP and AV disease Increase afterload = Decrease Stroke Volume *LV needs to try and eject blood against higher pressure (amount of blood ejected is reduced) |
|
|
What do we use to evaluate systolic function?
|
– Stroke volume
– Cardiac output – Ejection fraction – Cardiac index |
|
|
Stroke Volume Formula
|
SV = EDV – ESV
SV = CSA * LVOT TVI CSA = .785 * LVOTd^2 |
|
|
Normal Stroke Volume Values
|
70–100 cc (Reynolds)
50–90 cc (Mayo) |
|
|
Cardiac Output Definition
|
Amount of blood ejected from the heart per minute.
|
|
|
Cardiac Output Formula
|
CO = SV * HR
|
|
|
Cardiac Output Normal Values
|
4–8 L/min (Reynolds)
4–7 L/min (Mayo) |
|
|
Cardiac Index Definition
|
Refers to cardiac output in relation to BSA (body surface area.
|
|
|
Cardiac Index Formula
|
CI = CO/BSA
|
|
|
Cardiac Index Normal Values
|
2.5–4.5 L/min/m^2
|
|
|
Ejection Fraction Definition
|
Percent of blood ejected per beat.
|
|
|
Ejection Fraction Formulas
|
EF = SV/EDV *100
EF = LV EDV – LV ESV/LV EDV *100 EF = LVEDD^2 – LVESD^2/LVEDD^2 *100 |
|
|
Ejection Fraction Normal Values
|
55–75% (usually 50–70%)
Mildly reduced: 40–50 Moderately reduced: 30–40 Severely reduced: < 30 |
|
|
What is the #1 pitfall for assessing cardiac function by echo?
|
Ventricular geometry: Assume that the ventricle is symmetrical, the apical area is hemi–eliptical, and the basal area is cylindrical.
*not all hearts are like this |
|
|
Ventricular volumes can be calculated from:
|
M–mode: using linear measurements
2D and Biplanes: using cross sectional areas 3D: using volume measurements |
|
|
Systolic function during exercise:
|
– Cardiac output increases
– Stroke volume increases – Ejection fraction increases – Volumes decrease (EDV and ESV) |
|
|
Abnormal Systolic Function in M–Mode
|
– EPSS >10 is abnormal
– If the LA wall is straight across with no motion that is abnormal – B–notch, premature MV closure, premature AV opening all indicate increased LVEDP |
|
|
Advantages of M–Mode Assessment of Systolic function:
|
– Good endocardial definition
– Timing with EKG |
|
|
Disadvantages of M–Mode Assessment of Systolic function:
|
– Overestimation of chamber size (if oblique view)
– Overestimation of ejection fraction (if wall motion abnormalities present) |
|
|
Qualitative Evaluation of LV Function:
|
– 2D
– M–Mode – Volumes – Global Strain – %FS (fractional shortening) – EPSS – Wall Stress – LV Mass |
|
|
Requirements/Limitations for 2D Volumes
|
– Must see apex
– Use multiple planes (A2C, A4C) – Good wall definition Limitations: geometric assumptions |
|
|
What is the ASE recommended 2D method for volume measurements?
|
Bi–Plane Apical Simpson's (Bi–plane ellipsoid)
– A4C and A2C – Measure at end diastole for biggest – Measure at end systole for smallest – If walls aren't very defined––consider contrast agent |
|
|
Bi–Plane Simpson's EF Formula
|
EF = LV EDV – LV ESV/LV EDV *100
**USE AVERAGE OF A4C and A2C VOLUME MEASUREMENTS!!!** |
|
|
Fractional Shortening Formula and Normal Values
|
LVIDd – LVIDs/ LVIDd * 100
Normal: 25–45% |
|
|
EPSS
|
– E Point Septal Separation
– Due to LV enlargement and decreased flow across MV – Normal Range: 2–7 mm (>10 is abnormal) |
|
|
LV Mass
|
– Total weight of myocardium
– Calculated by M–mode OR 2D Normal Values: Men– Mass: 88–224 g, Mass/BSA: 49–115 g/m^2 Women– Mass: 67–162 g, Mass/BSA: 43–95 g/m^2 |
|
|
Which M–Mode measurements are needed to calculate LV mass?
|
– LVPWd
– IVSd – LVDd |
|
|
Strain
|
– "Deformation Imaging"
– Assessment of myocardial function – Based on tissue doppler imaging and speckle tracking – Goal is for a negative number––the more positive it is the more dysfunctional ***based off idea that heart pumps more like you would ring out a towel (base one way, apex the other)*** |
|
|
What assumptions are made when calculating stroke volume?
|
– CSA was measured accurately
– Circular geometry – Laminar flow with flat profile – Measuring parallel to flow for most accurate velocity – Diameter and velocity measurements are from same anatomical site |
|
|
What happens to SV when after load increases? When preload increases?
|
Increased afterload = decreased SV
Increased preload = increased SV |
|
|
What does exercise do to SV?
|
Increases the SV
|
|
|
Acceleration Time
|
– Length of time it takes from onset of flow to peak velocity
– Measured by PW Doppler with either aortic or pulmonic flow – Normal AT for Aortic flow: 83–118 msec |
|
|
Ejection Time
|
– Measures time blood is being ejected from LV
– Measured by Doppler or M–Mode (from AV opening to AV closure Normal ET Value: 265–325 msec |
|
|
dP/dT
|
– Measures rate of change in pressure over time
– Change in pressure/change in time – MUST have MR to measure dP/dT Normal Values: >1200 is normal |
|
|
LIMP
|
– Left Index of Myocardial Performance
– Increase in LIMP indicates LV dysfunction – LIMP = MV closure to opening/AV ejection time Normal Values: 0.35 (+/–0.05) (unitless) |
|
|
What other modalities assess systolic function?
|
– 3D Echo
– Acoustic Quantification – Doppler Tissue Imaging – Color Kinesis |
|
|
Views to evaluate RV systolic function/what is assessed in each view: |
- PLAX, RVIF, PSAX, A4C, Para-Apical, SC4C - Assess shape, size, wall thickness, motion of RV free wall, and patterns of septal motion |
|
|
Assessing RV Shape |
- Triangular shape: broad base and narrow apex - RV apex: closer to base than LV apex - No simple geometric shape, which makes it difficult to assess because it wraps around the LV |
|
|
Assessing RV size by comparing to the LV: |
- Normal: smaller than LV with RV apex more basilar than LV apex - Mildly dilated: RV enlargement, but still smaller than LV - Moderately dilated: RV size = LV size - Severely dilated: RV size > LV size |
|
|
Measuring RV size: |
- Basal dimension measured at annulus in 4C (< or = 4.2 cm) - Wall thickness measured in SC (< or = 0.5 cm) - Outflow tract distal diameter measured in PSAX (< or = 2.7 cm) - Outflow tract proximal diameter measures in PLAX (< or = 3.3 cm) |
|
|
What causes RV dilation? |
- Volume overload: ASD, TR, PR - Pressure overload: pulmonic valve stenosis, pulmonary embolism |
|
|
Assessing RV Wall Thickness |
- Measured in SC view - Normal RV wall thickness: < 0.5 cm - Thick walls point to pressure overload |
|
|
TAPSE |
- Tricuspid annular plane systolic excursion - Assessed with M-mode in A4C - Measures distance of tricuspid annular movement between end-diastole and end-systole - Normal: > 1.6 cm |
|
|
TASV |
- Tricuspid annular systolic velocity - Measured by tissue doppler and PW doppler - Normal: > 10 cm/sec |
|
|
RIMP |
- Right index of myocardial performance - Not dependent on HR or BP - Dependent on myocardial contractility and relaxation (related to SV, CO, and EF) - Predicts survival of PHTN patients - Normal: 0.28 + or - 0.04 |
|
|
Normal Septal Motion |
Diastole: LV circular in SAX, septal curvature convos toward RV and concave toward LV Systole: Septum thickens, moves toward center of LV, LV circular in SAX |
|
|
Septal Motion in RV Volume Overload |
Diastole: Reversed curvature, D-shaped LV Systole: Normalization of curvature |
|
|
Septal Motion in RV Volume Overload |
- Paradoxical septal motion - Curvature of septum is reversed in systole and mid-diastole - RV pressures exceed the LV pressures and there is a D-shaped LV in both systole and diastole |
|
|
RVSP |
- Right ventricular systolic pressure - RVSP = 4(TR velocity)^2 + RA pressure - Normal: 15-30 mmHg |
|
|
Estimation of RA Pressure |
Normal~~≤ 2.1 cm~~Decrease > 50%~~0 – 5 mmHg (3 mmHg ASE) Normal~~≤ 2.1 cm~~Decrease ≤ 50%~~5 – 10 mmHg (8 mmHg ASE) Dilated~~> 2.1 cm~~Decrease > 50%~~10 – 15 mmHg Dilated~~>2.1 cm~~Decrease ≤ 50%~~15 – 20 mmHg (15 mmHg ASE) |
|
|
Values for Abnormal RVSP |
Mild PHTN -- 30-40 mmHg Moderate PHTN -- 40-70 mmHg Severe PHTN -- >70 mmHg |
|
|
Pitfalls/Limitations of Assessing RVSP with Doppler |
- Needs to be parallel to TR jet - Need good envelope of TR - Mistaking MR for TR (MR velocity is > TR velocity) |
|
|
PAEDP |
- Diastolic Pulmonary Artery Pressure - Reflects PA to RV end diastolic pressure difference - Normal: 4-12 mmHg *Must have good PR to measure |
|
|
Swan-Ganz Catheter |
- Gold standard to measure PA pressures - Placed in subclavian vein and threaded through right side of heart (SVC-RA-RV-MPA-Pulmonary bed) |
|
|
Venous Return |
- Flow of blood from venous system to RA - Decreased venous return: decrease CO and SV, increases HR - Increased venous return: increase CO and SV, decreases HR |
|
|
Maneuvers that Decrease Venous Return |
- Valsalva - Amyl Nitrate - Standing from squatting - Expiration |
|
|
Maneuvers that Increase Venous Return |
- Isometric handgrip - Straight leg raises - Squatting - Inspiration |
|
|
Heart Failure |
- Heart's inability to meet the metabolic demands of the body. - Occurs due to systemic or pulmonary congestion due to decreased myocardial contractility - Can cause: abnormal systolic function, pressure/volume overload, diastolic dysfunction |
|
|
Left Heart Failure |
- Failure of LV is caused by congestion of pulmonary capillaries - Caused by congestion in lungs due to back up of blood into pulmonary veins and capillaries causing LV to fail - Increased pressure in pulmonary bed |
|
|
Right Heart Failure |
- Cor Pulmonale - Failure of right heart caused by prolonged high blood pressure in PA and RV - Caused by congestion in systemic circulation which causes RV to fail - Can develop from long standing left heart failure or pulmonary disease |
|
|
Normal Intracardiac Pressures
|
RA: 5 mmHg RV: 25/5 mmHg PAP: 25/5 mmHg LA: 10 mmHg LV: 120/10 mmHg AO: 120/80 mmHg |
|
|
Test Accuracy |
- Basedon % of patients who are correctly identified as having the disease or not - CalculatedBy: Sumof True Positives and TrueNegatives dividedby total number of tests performed |
|
|
Sensitivity / Specificity |
- Sensitivity identifies all true + patients (goal is to diagnose) - Specificity identifies all true - patients (confirms diagnosis) - IncreaseSensitivity = DecreaseSpecificity - DecreaseSensitivity = IncreaseSpecificity |
|
|
Sensitivity |
Probability that the test is “+” in a patient with the disease. |
|
|
Specificity |
Probability that the test is “-” in apatient that does not havethe disease. |
|
|
Indications for TTE |
- Screening Exams - Monitoring Exams - Peri and Post-Intervention - Baseline echo |
|
|
Indications for TEE |
**TEEHas Higher Sensitivity thanTTE
- Probe in Esophagus - Posteriorto heart - Imaging of Posterior Cardiac Structures |
|
|
Indications for Stress echo: |
- Higher Sensitivity thanStress EKG - Used if baseline EKG abnormalities exist, to aid in diagnosis of CAD, assess outcome of intervention |
|
|
Contrast Echo |
AgitatedSaline: - Usedfor bubble studies - To assess for shunts (ASD, VSD,PFO) and to highlight TR jets - Bubble size > pulm. capillaries Contrast Agents: - Usedfor LV optimization (LVO) - Gas filled microbubbles - Bubble size < pulm. capillaries |
|
|
Directed Exam |
- Must rule IN OR OUTreason for exam - Assess additionalabnormalities as they arise |
|
|
Comprehensive Exam |
- PerformDEFINITE set of images perset protocol - Regardlessof symptoms or findings |