![]()
![]()
![]()
Use LEFT and RIGHT arrow keys to navigate between flashcards;
Use UP and DOWN arrow keys to flip the card;
H to show hint;
A reads text to speech;
18 Cards in this Set
- Front
- Back
|
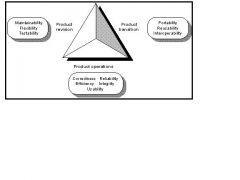
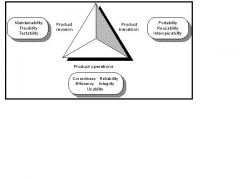
Diagram of Software Quality Factors as describe by McCall in 1977. The basic tool used to identify the important software quality factors is the Software QualityFactor Survey The formal definitions of each of the eleven software quality factors are provided on that form.
|
What is this?
|
|
|
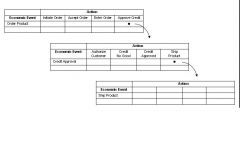
This shows cascading test matrices.
|
What is shown here?
|
|
|
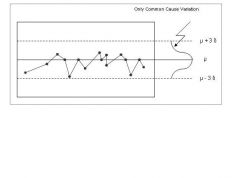
This is a control chart of a stable process-- there are no results falling outside of 1 standard deviation above the control.
|
What is this?
|
|
|
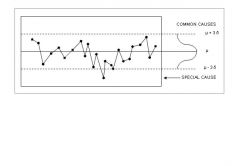
This is a control chart of an unstable process. Results fall more than 1 standard deviation outside the control.
|
What is this?
|
|
|
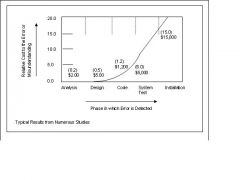
The cost of errors found at different stages of the SDLC. The later the error is detected, the more costly the fix.
|
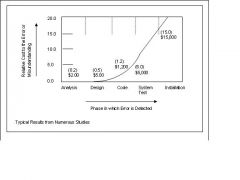
What does this chart show?
|
|
|
This is a cost of quality diagram. Money spent beyond expected production costs (labor,materials, equipment) to ensure that the product the customer receives is a quality (defect free)product. The Cost of Quality includes prevention, appraisal, and correction or repair costs.
|
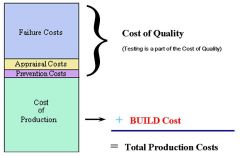
What does this image show?
|
|
|
This is a high level test plan diagram. With a test plan, testing can be considered complete when the plan
has been accomplished. The test plan is a contract between the software stakeholders and the testers. |
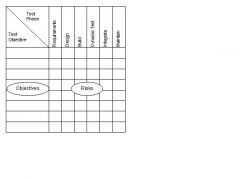
What is this?
|
|
|
This shows the impact of not measuring quality factors. The cost-benefit relationship and the life cycle implications of the software quality factors should be considered when selecting the important factors for a specific system.
|
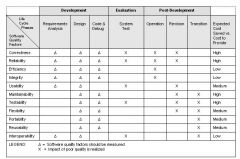
What is this?
|
|
|
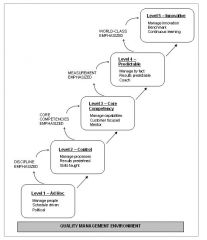
This shows the levels of process maturity as defined by SEI (Carnegie Melon Software Engineering Institute) for the DOD. More mature processes result in more effective software development.
|
What is this?
|
|
|
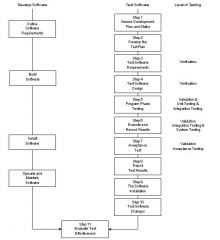
A diagram of life cycle testing. Life cycle testing involves continuous testing of the solution even after software plans are complete and the tested system is implemented. At several points during the development process, the test team should test the system in order to identify defects at the earliest possible
point.Life cycle testing cannot occur until you formally develop your process. |
What is this?
|
|
|
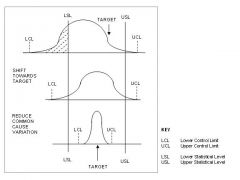
Variation due to special causes must be identified and removed to create a stable process. However, a stable process may not be an acceptable process. If its
variation, due to common causes results in operation of the process beyond specifications, the process is called “incapable.” The process must be improved, i.e., variation due to common cause must be reduced or the process retargeted or both. This illustrates the transition of a process from incapable to capable. |
What does this illustrate
|
|
|
McCall's Diagram is the basic tool used to identify the important software quality factors from the Software Quality Factor Survey.
|
What is this?
|
|
|
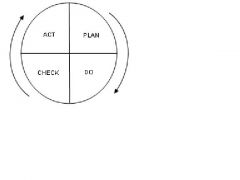
The Plan Do Check Act (PDCA)
cycle. The PDCA cycle is a conceptual view of a process. |
What does this show?
|
|
|
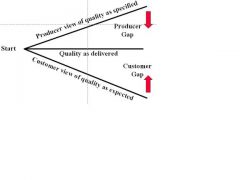
The two software quality gaps.
|
What is this?
|
|
|
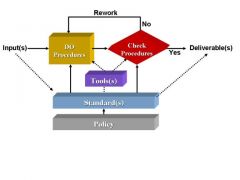
A workbench diagram.
|
What is this?
|
|
|
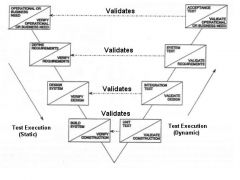
The V Model shows testing activities that occur during each phase of the SDLC. Static Execution on the left and Dynamic Execution on the right.
|
What is this?
|
|
|
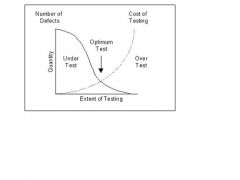
This is the Testing Cost Curve. As the cost of testing increases,
the number of undetected defects decreases. The left side of the illustration represents an under test situation in which the cost of testing is less than the resultant loss from undetected defects. |
What is this?
|
|
|
This diagram shows that the later in the SDLC a defect is found, the more it costs to fix it.
|
What relationship does this show
|

