Reading...
![]()
Play button
![]()
Play button
![]()
Use LEFT and RIGHT arrow keys to navigate between flashcards;
Use UP and DOWN arrow keys to flip the card;
H to show hint;
A reads text to speech;
82 Cards in this Set
- Front
- Back
|
Balance Sheet
|
A statement of an organization's financial conditions showing assets, liabilities, and owner's equity as of a particular date.
|
|
|
************************************
Central Tendency ************************************ |
************************************The one outcome that best represents all possible outcomes that are included in a probability distribution; 3 ways to measure the central tendency are mean, median and mode.
************************************ |
|
|
************************************
Coefficient of Variation ************************************ |
************************************
Quotient derived by dividing the standard deviation of a distribution by the mean of the distribution. ************************************ |
|
|
************************************
Dispersion ************************************ |
************************************Extent to which values are varied and not concentrated around the distribution's expected value, or mean.
************************************ |
|
|
Empirical probability
|
Estimated by studying the loss experience of a historical sample, the accuracy of the probability is affected by sample size and adequate representation.
|
|
|
Expected Value
|
The mean of an empirical distribution; weighted average of all probability distribution's possible results
|
|
|
Hazard Analysis
|
Identifying and analyzing conditions that make loss exposures more frequent or severe.
|
|
|
Hold Harmless agreement / Indemnity Contract
|
A contract in which one party (the indemnitor) agrees to assume the legal liability of a second party (the indemnitee)
|
|
|
Income Statement
|
A financial report showing profit or loss for a particular period; computes expenses incurred with revenues generated.
|
|
|
Indemnification
|
The process that restores a person or business to the financial condition he or it was in before the loss.
|
|
|
Law of Large Numbers
|
A mathematical principle that states that as there is an increase in the number of independent events, the actual relative frequency of each of the potential results more nearly approaches the relative frequency expected theoretically for that outcome.
|
|
|
Maximum Possible Loss (MPL)
|
An estimate of the largest possible loss that might occur from a single event or at one location
|
|
|
Mean
|
The average of numbers; the sume of the values in a sequence of value divided by the number of values
|
|
|
Median
|
The middle value of a sequence of values with an odd number of values; for a sequence of values with an even number of values, the mean of the 2 middle values.
|
|
|
Mode
|
The distribution value that occurs most often
|
|
|
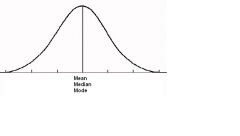
Normal Distribution
|
Type of symmetrical probability distribution used to forecast the variability of events; on a graph, a normal distribution shows a bell-shaped curve.
|
|
|
Probability Analysis
|
A method used to forecast events that affect a company's operations such as business and accidental loss; the analysis is based on the assumption that the events are controlled by a constant probability distribution.
|
|
|
Probability Distribution
|
Table or graph presentation of all potential outcomes of a set of circumstances and the probability that each outcome will occur.
|
|
|
Probable Maximum Loss (PML)
|
The estimated value of the largest loss that is likely to occur.
|
|
|
************************************
Standard deviation ************************************ |
************************************
The average of the differences (i.e. deviations) between the potential results and the result's expected value (mean); the square root of the average of the squares. ************************************ |
|
|
Statement of cash flows/ Statement of sources and uses of funds
|
A financial statement showing an organization's cash receipts and cash payments during a specific period for operating, investing, and financing activities.
|
|
|
Theoretical Probability
|
Projection of the probability of a particular outcome based on theoretical principles rather than actual observation of outcomes.
|
|
|
************************************Methods of identifying Loss exposures
************************************ |
************************************
************ ICED***************** 1) In-person inspection of facilities 2) Compliance reviews (conducted by accountants and Attorneys...can be expensive in terms of $ and time) 3. Experts inside and outside the organization can ID loss exposures, esp. in the area of Hazard Analysis 4. Document Analysis ************************************ |
|
|
What are the main types of documents used to ID loss exposures?
|
Memory Aid: CO-FLAIR
1. Contracts 2. Organization's records and policies 3. Flowcharts and organizational charts 4. Loss histories 5. Accounting records and financial statements 6. Insurance policies 7. Risk assessment checklists and questionnaires |
|
|
Documents Examined to ID loss exposure: Contracts. How can contracts generate liability loss exposures?
|
1. A business can accept another party's loss exposures thru a hold harmless areement
2. A business can fail to honor a valid contract (manufacturer fails to deliver contracted goods) |
|
|
Give a description of Flowcharts and Organizational charts, and how they aid in identifying loss exposures.
|
1. Flowcharts - show flow of resources as well as relationships b/w operations - can indicate where loss exposures exist
2. Organizational Charts - personnel who may create personnel loss exposures. Allow us to track how info flows |
|
|
What is one disadvantage of using Loss Histories?
|
They are incomplete because they only reflect past losses, and don't take into consideration any post-loss changes we may have made
|
|
|
What can new or small organizations use to ID exposures?
|
Loss histories for comparable organizations
|
|
|
How can Accounting Records and Financial statements.
help us ID loss exposures? |
They ID current and past exposures that may indicate loss exposure in the future.
|
|
|
List types of Accounting Records and Financial Statements.
|
1. Balance Sheets
2. Income Statements 3. Statement of Cash Flows |
|
|
What is the main advantage of using Accounting Records and Financial Statements to ID loss exposures?
|
They help us ID major areas of loss exposure (ex: Asset section of balance sheet can ID property loss exposures)
|
|
|
What is the main disadvantage of using of using Accounting Records and Financial Statements to ID loss exposures?
|
They ID most major categories of loss exposure (except personnel) but they do not ID INDIVIDUAL loss exposures (ex: property is ID'd a loss exposure, but we don't know which one specifically)
|
|
|
Documents Examined to ID loss exposure: Risk Assessment Checklists and Questionnaires.
What are 2 disadvantages of Quesionnaires? |
1. Take time to fill out
2. May not recognize all loss exposures (if standardized, may miss loss exposures that apply to a specific industry) |
|
|
************************************
What are the dimensions used to analyze a loss exposure? (considered jointly & separately) ************************************ |
************************************
1. Loss frequency 2. Loss severity ($ amount of a specific loss) 3. Total dollar losses for all occurrences in a given period 4. Timing of losses and payments ************************************ |
|
|
Loss Frequency vs. Relative frequency
|
*Loss frequency = the number of losses within a given period
*Relative frequency = number of losses occurring in a given period relative to number of exposure units. *These 2 are the same with one exposure unit, but not with multiple units (ex: 50 veh accidents in a fleet of 5,000...loss freq = 50, but relative freq = 50/5,000 (.01 per veh per year) |
|
|
Relative frequency can be estimated based on ____________. Give examples.
|
Previous experience
Example: Auto accidents per mile driven, injuries per person per hour (workers com) |
|
|
Accuracy of data for loss frequency is influenced by _____________________.
|
The law of large numbers
|
|
|
For low-frequency, high-severity incidents, how are predictions made, and are they useful?
|
Even large organizations lack sufficient exposure units to make good prediction, but even predictions with a wide margin of error are better than none if we are aware of limitations.
|
|
|
What 2 types of estimates are used to determine Loss Severity?
|
1. Maximum Poss Loss (MPL): an estimate of the largest possible loss that might occur from a single event or at one location
2. Probable Maximum Loss (PML): The estimated value of the largest loss that is likely to occur. |
|
|
Which is usually lower, PML or MPL? Why?
|
PML is usually much lower than MPL.
Ex: With fire damage, MPL is usually the total building and contents value, whereas PML is much less because of sprinkler systems and fire departments. |
|
|
************************************
The Prouty Approach ************************************ |
************************************
A method of risk exposure analysis that tells us how to treat loss exposures by classifying loss frequency and severity into categories. ************************************ |
|
|
************************************
The Prouty Approach: Loss frequency categories ************************************ |
************************************
1. Almost nil (no possibility) 2. Slight (possible, not likely) 3. Moderate (occasional) 4. Definite (regular) ************************************ |
|
|
************************************
The Prouty Approach: Loss severity categories ************************************ |
************************************
1. Slight (loss easily absorbed) 2. Significant (must finance part of loss) 3. Severe (must finance most of loss to survive) ************************************ |
|
|
There is usually an __________ relationship between loss frequency and severity. What does this mean?
|
Inverse
The most severe losses occur less often |
|
|
Activities with slight-value losses that most likely will occur will....
|
not need to be avoided
|
|
|
Activites with significant- or severe-value losses will tend to...
|
be avoided even if they have almost no chance of occurring.
|
|
|
Do minor, frequent losses that result in significant cumulative losses (ex: shoplifting) need risk managment attention?
|
YES!
They need as much risk managment attention as large, infrequent losses (ex: fire) |
|
|
Define total dollar losses
|
The total dollar amount of losses for all occurrences in a given period
|
|
|
Why is timing of payments so important?
|
1. When a loss is counted affects treatment for tax and accounting
2. Money held in reserve can earn interest |
|
|
When are property loss payments usually made?
|
Soon after losses
|
|
|
When are liability loss payments usually made?
|
Can be delayed depending on litigation
|
|
|
When are disability loss payments made?
|
May be paid over an extended period.
|
|
|
What does credibility of data refer to?
|
The level of confidence that existing data will accurately indicate future losses
|
|
|
What 2 issues affect data credibility?
|
1. Age of data
2. Whether data are based on actual or estimated losses |
|
|
4 characteristics of data that make the discovery of patterns in past data possible
|
CROC
1. Organized 2. Consistent 3. Relevant 4. Complete |
|
|
What does it mean for data to be organized?
|
Loss data should be organized in an array (listed in decreasing or increasing value) to reveal clustering by severity, and to call attention to big losses
|
|
|
In what 2 areas must data be consistent?
|
1. Collection: must use the same technique or source (ex: rounding/estimating)
2. Must be adjusted for price level changes and expressed in constant dollars using a price index to account for inflation |
|
|
We use indexing factors on a/an _________ basis.
|
Annual
|
|
|
Can losses recorded in different periods without adjusting for inflation be compared? Why or why not?
|
No...because inflation will cause similar losses to be recorded at very different amounts.
|
|
|
Probability analysis is useful for organizations with what?
|
*A large volume of data on past losses
*Stable operations |
|
|
What is the assumption of probability analysis?
|
That future events will repeat past events to some degree.
|
|
|
Probability
|
The relative frequency with which an event is anticipated to occur over a long period in a stable environment
|
|
|
4 characteristics of probabilities
|
1. The probability of a comletely impossible event: 0
2. The probability of a definitely certain event: 1.0 3. The probability of every event that is neither definitely certain nor completely impossible: greater than 0 but less than 1.0. 4. Probabilities can be expressed as a %, fraction, or decimal. |
|
|
Compare empirical probability and Theoretical probability
|
*Empirical - estimated by studying the loss experience of a historical sample
*Theoretical - projection of probability of an outcome based on theoretical principles not actual observations |
|
|
Example of Theoretical probability
|
If a coin is tossed a number of times, there is a theoretical probability of an equal number of head and tails because one side is heads and the other side is tails.
|
|
|
For probability analysis, what are the 3 data sources?
|
1. Loss experience of own organization
2. Loss experience of similar organizations 3. National data from insurance rating organizations, insurance companies, and other national organizations. |
|
|
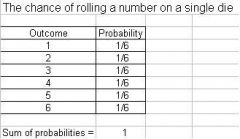
Rules of Probability Distribution
|
1. The sum of probabilities must be 1.0
2. Mutually exclusive: only 1 possible outcome exists 3. Collectively exhaustive: possible outcomes are the only possible result...the outcomes exhaust all possibilities 4. Law of large numbers applies |
|
|
What 3 criteria must be met for the Law of Large Numbers to apply to future forecasts?
|
1. The events have occurred at an earlier time under similar conditions and resulted from basic, unchanging forces
2. The event is anticipated to occur again at some point in the future under the same coditions 3. The events are numerous, independent of one another, and essentially identical. |
|
|
Sample Probability Distribution Table
|
|
|
|
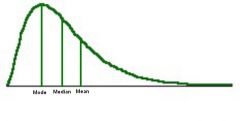
Skewness
|
Distribution is either symmetrical (hump in the center) or asymmetrical (hump to one side, and long tail on the other side)
|
|
|
Symmetrical Distribution
|
|
|
|
Positively Skewed
|
|
|
|
Negatively Skewed
|

|
|
|
Negative skewed distribution happens__________. Give an example
|
only rarely.
Example: unprotected properties where fire, flood or explosion losses are total |
|
|
What is the most frequent distribution pattern? Give an example
|
Positive skewed distribution
Example: loss of protected property by fire, theft, or flood. |
|
|
What % of outcomes in a normal distribution are within 2 standard deviations above or below the mean?
|
95.44%
|
|
|
Mean vs. Expected Value
|
*Mean is found by weighing each observed result by the frequency with which the result happens
*Expected value is found by weighing each possible result by its probability |
|
|
************************************
List a normal distribution's standard deviation ************************************ |
************************************
*68.26% of all outcomes are one standard deviation or less from the mean *95.44% are 2 standard deviations or less from the mean *99.74% are 3 standard deviations or less from the mean ************************************ |
|
|
************************************
Continuous probability distributions for losses ************************************ |
************************************
The number of possible outcomes can be any number within a certain range of numbers. ************************************ |
|
|
************************************
Discrete probability distributions for losses ************************************ |
************************************
A certain number of possible outcomes exists ************************************ |
|
|
Probability density functions
|
Horizontal axis represents possible outcomes, where the vertical represents the probability of those outcomes.
|
|
|
The probability density functions must equal _______
|
one
|