![]()
![]()
![]()
Use LEFT and RIGHT arrow keys to navigate between flashcards;
Use UP and DOWN arrow keys to flip the card;
H to show hint;
A reads text to speech;
214 Cards in this Set
- Front
- Back
|
COSO 5 Components |
Control Environment Risk Assessment Information and Communication Monitoring Existing Control Activities |
|
|
COSO issued Enterprise Risk Management Components |
Internal Environment Setting Objectives Event Identification Assessment of Risk Risk Response Activities (Control) Information and Communication Monitoring |
|
|
Internal Benchmarks
|
Control Charts: used in Statistical Quality Control (Goalpost Conformance) Pareto Diagrams: used to determine the QC issues most frequent by type (Histogram with Line Graph) Cause-and-Effect (Fishbone) Diagram: Used to analyze the problems that contribute to the occurrence of defects |
|
|
Cost Objectives
|
Product Costing: inventory and COGM and COGS Income Determination: Profitability Efficiency Measurements: Comparisons to Standards |
|
|
Traditional Application of Overhead
|
1) OH Rate = Budgeted OH Costs / Estimated cost driver ~Cost driver could be DL$, DLH, or MH 2) Applied OH = Actual cost driver x OH Rate |
|
|
Calculation of Cost of Goods Manufactured (COGM) |
WIP, Beginning + DM Used + DL + MOH Applied -WIP, Ending =COGM |
|
|
Calculation of Cost of Goods Sold (COGS)
|
FG, Beginning + COGM = Cost of Goods Available for Sale - FG, Ending = COGS |
|
|
Equivalent Units (Weighted Average Method)
|
Units Completed + WIP, Ending (Units x % complete) = Weighted Average EU |
|
|
Equivalent Units (FIFO Method) |
WIP, Beginning (units x % TO complete) + Units completed and started this period (Units completed - beginning inventory units) + WIP, Ending (Units x % complete) = FIFO EU |
|
|
Cost per EU (Weighted Average Method)
|
Beginning Cost + Current Cost Equivalent Units |
|
|
Cost per EU (FIFO Method)
|
Current Cost Equivalent Units |
|
|
Calculate Direct Materials
|
DM, Beginning + Purchases + Transport In - Return/Allowances = Materials available - Cost of Materials Used = DM, Ending |
|
|
Contribution Margin
|
Sales - Variable Costs
|
|
|
Breakeven in Units
|
Total Fixed Costs CM per unit |
|
|
Breakeven in Dollars
|
Unit Price x BE units OR Total Fixed Costs CM Ratio |
|
|
Margin of Safety in Dollars |
Total Sales $ - BE Sales $
|
|
|
Margin of Safety %
|
Margin of Safety $ Total Sales $ |
|
|
Direct Materials Price (P) Variance
|
Actual Q Purchased x (Actual P - Standard P)
|
|
|
Direct Materials Quantity (Q) Usage Variance
|
Standard P x (Actual Q Used - Std. Q Allowed)
|
|
|
Direct Labor Rate Variance
|
Actual Hours x (Actual Rate - Standard Rate)
|
|
|
Direct Labor Efficiency Variance
|
Standard Rate x (Actual Hours - Standard Hours)
|
|
|
Sales Price (P) Variance (aka Sales Revenue Flexible Budget Variance) |
Actual Q Sold x (Actual P/unit - Budgeted P/unit)
|
|
|
Sales Volume Variance
|
Standard CM$/unit x (Actual Q Sold - Budget Q)
|
|
|
Variable Overhead Spending Variance
|
Actual hours x (Actual Rate - Standard Rate)
|
|
|
Variable Overhead Efficiency Variance
|
Standard rate (Actual hours - Std hours @ actual production)
|
|
|
Fixed Overhead Spending Variance |
Actual FOH$ - Budgeted FOH$
|
|
|
Fixed Overhead Volume Variance
|
Budgeted FOH$ - (Std Rate x Actual Production)
|
|
|
Market Share Variance
|
Actual MS - Budget MS x Actual industry units x Budgeted CM/unit
|
|
|
Absorption Approach vs. Contribution Approach
|
Absorption Approach: 1) Used for GAAP and financial reporting 2) Treats FOH as Product Costs Contribution Approach: 1) Used for Internal Decision Making 2) Treats FOH as Period Costs |
|
|
Absorption Approach vs. Contribution Approach Effect on Net Income
|
No Change in Inventory: Absorption = Variable Increase in Inventory: Absorption > Variable Decrease in Inventory: Absorption < Variable |
|
|
Budget Order
|
Sales > Production > DM, DL, FOH > COGS > Cash
|
|
|
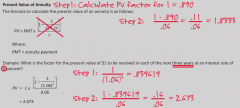
Present Value Factor
|
FV (1 + r)^n |
|
|
Present Value of an Annuity Factor
|
|
|
|
Profitability Index
|
PVFCF / Cost
|
|
|
Payback Period |
Initial Outflow Annual After-Tax CF (assuming annuity) |
|
|
Operating Leverage
|
%Change in EBIT %Change in Sales |
|
|
Financial Leverage
|
%Change in EPS %Change in EBIT |
|
|
Weighted Average Cost of Capital
|
Cost of equity (Equity % in Capital Structure) x Weighted average cost of debt (Debt %) Cost of debt must be after-tax > WAC of Debt (1-T) |
|
|
Weighted Average Interest Rate (Cost of Debt)
|
Effective Annual Interest Payments Debt Cash Available |
|
|
Cost of Preferred Stock
|
Preferred Stock Dividends Net proceeds of Preferred Stock |
|
|
Cost of Retained Earnings (Common Stock)
|
1) Capital Asset Pricing Model (CAPM) = RF + [B (Market Return - RF)] ; B > 1 Riskier ; B < 1 Less Risky 2) DCF = (D1 / P0) + g; D1 = D0 x (1 + g) 3) Bond Yield Plus Risk Premium = Pretax Cost of LT Debt + Market Risk Premium |
|
|
Return on Investment
|
= Net Income / Investment Capital (D + E) OR = Profit Margin x Investment Turnover = (NI / Sales) x (Sales / Investment Capital) |
|
|
Profit Margin
|
Net Income / Sales
|
|
|
Investment Turnover
|
Sales / Investment Capital
|
|
|
Return on Assets |
Net Income / Average Total Assets OR = Profit Margin x Asset Turnover = (NI / Sales) x (Sales / Average Total Assets) |
|
|
Asset Turnover
|
Sales / Average Total Assets
|
|
|
Return on Equity
|
Net Income / Equity |
|
|
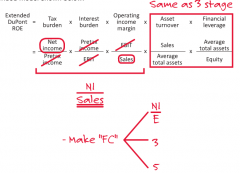
Dupont ROE
|
=Profit Margin x Asset Turnover x Financial Leverage =ROA x DFL * DFL = 1 + (D/E) = A / E |
|
|
Extended Dupont ROE
|
|
|
|
Current Ratio |
Current Assets Current Liabilities |
|
|
Quick (Acid Test) Ratio
|
Cash + MS + AR OR CA - Inventory - Prepaids Current Liabilities |
|
|
APR of Quick Pmt Discount
|
360 Discount Pay period - Disc Period x 100 - Discount % |
|
|
Cash Conversion Cycle
|
Inv. Conversion + AR Coll. - Payables period period deferral period |
|
|
Operating Cycle
|
Inventory Conversion + AR Collection Period Period (# of days to sell) (# of days to collect) |
|
|
Inventory Turnover
|
COGS Average Inventory |
|
|
Inventory Conversion Period
|
365 Inventory Turnover |
|
|
Accounts Receivables Turnover
|
Sales Average Accounts Receivables |
|
|
Accounts Receivables Collection Period
|
Days Sales outstanding = 365 AR Turnover |
|
|
Accounts Payable Turnover
|
COGS Average Accounts Payable |
|
|
Accounts Payable Deferral Period
|
365 Accounts Payable Turnover |
|
|
Economic Order Quantity (EOQ)
|
=Sqrt (2SO/C) =Sqrt [2 (Annual Sales Units)(Cost per PO)/Carry cost per unit] |
|
|
Effective Interest Rate
|
= Interest Paid Net Proceeds =Face Value (Stated Interest Rate) Face Value - (Taxes, Fees, etc.) |
|
|
Annual Percentage Rate
|
= Interest Paid Available Funds = (Face Val) (Stated Interest Rate) (Time Period) Face Value - (Taxes, Fees. etc) |
|
|
Perpetuities (Zero Growth)
|
PV = P = D/R D = Dividend R = Required Return |
|
|
Constant (Gordon) Growth Dividend Discount Model (DDM) |
Pt = Dt+1 (R - G) Pt = Current Price Dt+1 = Next year's Dividend R = Required Return G = Growth Rate |
|
|
Price Earnings Ratio
|
= P0 E1 P0 = Price or value today E1 = EPS expected in 1 year for forward or E0 for trailing |
|
|
PEG Ratio
|
= (P0 / E1) G G = 100 x Growth Rate |
|
|
4 Primary Roles of Business Operations
|
1) To Process Detailed Data (Transactional Processing) 2) To Provide Information Used for Daily Decisions (Tactical DDS) 3) To Provide Information used for Developing Business Strategies (Strategic EIS) 4) To Take Orders from Customers |
|
|
5 Function Performed on Data
|
1) Collect 2) Process 3) Store 4) Transform 5) Distribute |
|
|
Advantages to Centralized Processing (Disadvantages to Decentralized Processing)
|
1) Enhanced Data Security (A single location vs. multiple locations need to be secured) 2) Consistent Processing (Decentralized systems may result in inconsistent processing at the various processing locations) |
|
|
Disadvantages to Centralized Processing (Advantages to Decentralized Processing)
|
1) Possible High Cost (Transmission of all that data to the central site can be costly) 2) Increased need for Processing Power and Data Storage 3) Decrease in Local Accountability 4) Bottlenecks at high-traffic times 5) Delay in Response time 6) Increase Vulnerability (problems at the central site can impact the entire organization |
|
|
6 Different Report Outputs
|
1) Periodic Scheduled (made available on a regular basis to end users of the system) 2) Exception (made when a specific condition or exception occurs) 3) Demand/Pull (already exists and made available when requested) 4) Ad Hoc (doesn't currently exist but can be made on-demand) 5) Push Reports 6) Dashboard Reports |
|
|
Business Information Systems
|
1) Transaction Processing Systems 2) Management Information Systems (Tactical) 3) Decision Support Systems 4) Executive Information Systems |
|
|
Steps of Systems Development Life Cycle
|
Systems Analysis Design (Conceptual and Physical) Implementation and Conversion Training Testing Operations and Maintenance |
|
|
Five Focus Areas to Frame IT Governance (From the COBIT Framework) |
1) Strategic Alignment 2) Value Delivery 3) Resource Management 4) Risk Management 5) Performance Management |
|
|
7 Information Criteria
|
Integrity (Accuracy, Completeness, Validity) Confidentiality (Protection of Sensitive Information) Efficiency (Delivery of Information through the optimal use of resources) Reliability (Represents what it purports to represent) Availability (Providing current and future information as required) Compliance (With policies, laws, regulations, and contractual agmts) Effectiveness (Relevant or pertinent to a business process, and delivered in timely, correct, consistent, and useful manner) |
|
|
Four Domains of the COBIT Framework (PO AIDS ME) |
Plan and Organize (Provides Direction) Acquire and Implement (Provides Solutions) Deliver and Support (Provides IT Services to users) Monitor and Evaluate (Ensure that the direction provided in the planning and organizing steps are followed |
|
|
System Analyst Job Responsibilities |
For Internally Developed Systems 1) Determine system requirements 2) Designs the overall application system 3) Determines the type of network For Purchased Systems 1) Integrates the app with existing and purchased apps 2) Provides training to end users |
|
|
Application Programmer / Software Developer Job Responsibilities |
Writing and/or maintaining application programs *Should not have write/update access to data in production |
|
|
System Programmer Job Responsibilities |
Installing, supporting, monitoring, and maintaining the operating system *Should not have write/update access to data in production |
|
|
Computer Operator Job Responsibilities
|
Scheduling and running processing jobs *Automated in large environments |
|
|
IT Supervisor Job Responsibilities
|
Manage the function and responsibilities of the IT Department
|
|
|
File Librarian Job Responsibilities
|
Store and protect programs and tapes from damage and unauthorized use *Automated in large environments |
|
|
Data Librarian Job Responsibilities
|
Custody of and maintains the entity's data and ensures that production data is released only to authorized individuals when needed |
|
|
Security Administrator Job Responsibilities
|
Responsible for the assignment of initial passwords and often the maintenance of those passwords
|
|
|
Database Administrator Job Responsibilities
|
Responsible for maintaining and supporting the database software and performing certain security functions
|
|
|
Network Administrator Job Responsibilities
|
Support computer networks through performance monitoring and troubleshooting
|
|
|
Web Administrator Job Responsibilities
|
Responsible for information on a website
|
|
|
Segregation of Duties within Information Technology
|
1) Systems Analysts (System and Hardware Designer) vs. Computer Programmers (Software Designer) 2) Computer Operators vs. Computer Programmers (Could make unauthorized undetected changes 3) Security Administrator vs. Computer Operators and Computer Programmers (Could grant unauthorized access) |
|
|
Review Data Encryption
|
Page 35
|
|
|
What is Electronic Data Interchange?
|
Computer-to-computer exchange of business transactions. Any standard business document that one organization can exchange can exchange with another can be exchanged via EDI if both organizations have made the proper preparations; requires mapping. Reduces Handling Costs and Increases Processing Speed. Documents are exchanged via, VAN, Internet, or Communication Intermediaries Review pg. 40-41 |
|
|
Steps in a Disaster Recovery Plan
|
1) Assess the risks 2) Identify mission-critical applications and data 3) Develop a plan 4) Determine the responsibilities of the personnel involved 5) Test the disaster recovery plan |
|
|
Difference between Incremental and Differential Backup
|
Incremental backup involves copying only the data items that have changed since the last backup. Differential backup copies all changes made since the last full backup. |
|
|
Off-site Backup Locations
|
1) Cold Site: (1-3 days) location that has all the electrical connections and other physical requirements for data processing, but does not have the actual equipment 2) Hot Site: (Few Hours) location that is equipped to take over the company's data processing. 3) Warm Site: (1/2 day - 1 day) stocked with all the hardware. |
|
|
Business Cycle
|
1) Expansion 2) Peak 3) Contraction 4) Trough 5) Recovery |
|
|
Effects of Expansion on GDP, Profits, Unemployment, and Prices |
GDP: Increase Profits: Increase Unemployment: Decrease Prices: Decrease |
|
|
Effects of Contraction on GDP, Profits, Unemployment, and Prices
|
GDP: Decrease Profits: Decrease Unemployment: Increase Prices: Increase |
|
|
What is Peak?
|
-High point of economic activity -Likely to face capacity constraints and input shortage |
|
|
What is Trough? |
-Low point of economic activity -Significant excess production capacity -Labor decreases -Costs decrease |
|
|
What is Recovery?
|
GDP increases to long-term growth trend
|
|
|
Economic Indicators
|
1) Leading Indicators predict economic activity 2) Lagging Indicators tend to follow econonmic activity 3) Coincident Indicators change approximately the same time as the whole economy |
|
|
What is the Long-Run Aggregate Supply dictated by?
|
Resources not prices
|
|
|
What are the effects of a reduction (increase) in demand? |
GDP: Decreases (Increases) Profits: Decrease (Increases) Unemployment: Increases (Decreases) Price: Decreases (Increases) |
|
|
What are the effects of a reduction (increase) in supply? |
GDP: Decreases (Increases)
Profits: Decrease (Increases) Unemployment: Increases (Decreases) Price: Increases (Decreases) |
|
|
Factors that Increase Aggregate Demand (Shift to the Right) |
Taxes (Decrease) Wealth (Increase) Interest Rates (Decrease) Consumer Confidence (Increase) Exchange Rates (Depr./Weak Currencies) Government Spending (Increase) |
|
|
Multiplier Effect Calculation
|
Refers to the fact that an increase in spending produces a multiplied increase in level of economic activity (GDP) = 1 (1 - MPC) * 1- MPC = MPS |
|
|
Factors that Increase Aggregate Supply (Shift to the Right) |
Input Prices (Decrease) Supply are plentiful |
|
|
What is GDP?
|
The total spending of: -Households -Businesses -Federal, state, and local governments -Foreign sector |
|
|
Calculating GDP: Expenditure Approach
|
Government Purchases Gross Private Domestic Investment Personal Consumption Expenditures Net Exports (+ Net exports; - Net Imports) |
|
|
Calculating GDP: Income Approach
|
Income of Proprietors Profits of Corporations Interest (Net) Rental Income Adjustments for Net Foreign Income Taxes (Government Income) Employee Compensation (Personal Income) Depreciation |
|
|
Net Domestic Product (NDP) Calculation
|
GDP - Depreciation
|
|
|
Gross National Product vs. Gross Domestic Product
|
GNP differs from GDP because GNP includes goods and services that are produced overseas by U.S. firms and excludes goods and services that are produced domestically by foreign firms.
|
|
|
Net National Product (NDP) Calculation
|
GNP - Depreciation
|
|
|
National Income Calculation
|
NNP - Indirect Business Taxes
|
|
|
Disposable Income
|
Personal Income - Personal Taxes
|
|
|
Unemployment Rate Calculation |
Unemployment Rate = # of Unemployed x 100 Total Labor Force Total Labor Force: includes all non-institutionalized individuals 16 years of age or older who either are working or are actively looking for work. |
|
|
Types of Unemployment
|
1) Frictional Unemployment - Changing jobs / Temporarily laid off (Normal) 2) Structural Unemployment - Mismatched skills or location (Normal) 3) Seasonal Unemployment - Seasonal changes in Sales Cycle (Normal) 4) Cyclical Unemployment - Caused by decrease in AD or SRAS (Most concerned with in terms of business cycle) |
|
|
Natural Rate of Unemployment
|
Normal Rate = Frictional + Structural + Seasonal
|
|
|
What does full employment mean?
|
No cyclical unemployment
|
|
|
CPI Calculation
|
Base Year Cost of Market Basket |
|
|
Inflation Rate |
CPI this period - CPI last period x 100 CPI last period |
|
|
Demand-Pull Inflation
|
-Caused by increases in aggregate demand -Causes Unemployment to decrease |
|
|
Cost-Push Inflation
|
-Caused by reductions in short-run aggregate supply -Causes unemployment to decrease |
|
|
Review the Inflation and Value of Money
|
Page 20
|
|
|
Types of Budgeted Deficits
|
1) Financing Budget Deficit: Financed by government borrowing, which affects interest rates 2) Cyclical Budget Deficit: Caused by temporarily low economic activity 3) Structural Budget Deficit: Caused by a structural imbalance between government spending and revenue |
|
|
Calculation of Real Interest Rate
|
Nominal Interest Rate - Inflation Rate
|
|
|
Categorization of Money (M1, M2, M3)
|
M2 = M1 + CDs < $100k, money market deposit accounts, mutual funds, savings accounts M3 = M2 + CD > $100k |
|
|
Expansionary Monetary Policy Options |
1) Open Market Operations: Fed buys financial assets (gov. securities, etc.) from banks to increase MS 2) Lowering the discount rate the Federal Reserve charges for short-term loans, increases MS 3) Lowering the Required Reserve Ratio, increases MS *Increasing MS, decreases IR |
|
|
Difference between change in Quantity Demanded (Supplied) and change in Demand (Supply)
|
Change in Quantity Demanded is a movement along the demand curve; results from a change in price Change in Demand is a movement of the demand curve; results from a change in something other than price |
|
|
What is the Substitution Effect?
|
When price for a product goes up, the consumer will switch to a lower priced similar good. |
|
|
Factors that shift Demand Curves (other than Price)
|
Changes in: Wealth Price of Related Goods Consumer Income Consumer Tastes or Preferences for a Product Consumer Expectations Number of Buyers Served by the Market |
|
|
Factors that shift Supply Curves (other than Price) |
Price Expectations of the Supplying Firm Production Costs Price or Demand for Other Goods Subsidies or Taxes Production Technology |
|
|
When does a Surplus occur?
|
When there's a Price Floor, Supply > Demand i.e. Minimum Wage |
|
|
When does a Shortage occur? |
When there's a Price Ceiling, Demand > Supply i.e. Rent Control |
|
|
Price Elasticity of Demand (Supply) Calculation
|
% change in P |
|
|
If Ep < 1, then?
|
-Product is Price Inelastic -Product has a positive relationship with total revenue |
|
|
If Ep > 1, then?
|
-Product is Price Elastic -Product has a negative relationship with total revenue |
|
|
If Ep = 1, then?
|
-Product is Unit Elastic -No effect on total revenue |
|
|
Factors that increase Price Elasticity of Demand
|
2) Time Period Increases |
|
|
Factors that increase Price Elasticity of Supply
|
2) Ep will actually decrease if production times increase |
|
|
Cross Elasticity Ce Calculation
|
% change in Price of Y |
|
|
If Ce is positive, then?
|
Product is a Substitute Good |
|
|
If Ce is negative, then?
|
Product is a Complement Good |
|
|
If Ce is 0, then? |
Goods are unrelated |
|
|
Income Elasticity of Demand Ie Calculation
|
% change in # of units of X demanded
% change in Income |
|
|
If Ie is positive, then?
|
Product is a normal good
|
|
|
If Ie is negative, then?
|
Product is a inferior good |
|
|
Production Measures used to evaluate optimal production levels based on available inputs |
1) Total Product (TP) 2) Marginal Product = Change in TP / Change in Labor (L) 3) Average Product = TP / L |
|
|
4 Cost Functions used to Analyze and Forecast
|
2) Average Variable Cost (AVC) = Variable Costs (VC) / Q 3) Average Total Cost = TC / Q 4) Marginal Cost = Change in TC / Change in Q |
|
|
Review Production Costs in the Long Run
|
Page 42-43
|
|
|
Review Market Structures
|
Page 44-47 |
|
|
Describe Perfect Competition
|
-Homogenous Products -Many Firms -Firms are small relative to industry -No barriers to entry -Zero economic profits -Demand is perfectly elastic -Price is set by Market |
|
|
Perfect Competition Strategy
|
Maintain market share and responsiveness of the sales price to market conditions |
|
|
Describe Monopolistic Competition
|
-Differentiated Products -Many Firms -Firms are small relative to industry -Few barriers to entry -Zero economic profits -Demand highly elastic but downward sloping -Some influence on price through differentiation but have more control over Q produced than P |
|
|
Monopolistic Competition Strategy
|
Maintaining market share but also include a plan for enhanced product differentiation and extensive allocation of resources to advertising, marketing, product research, etc
|
|
|
Describe Oligopoly
|
-Differentiated Products -Few Firms -Firms are large relative to industry -Fairly significant barrier to entry -Positive economic profits -Kinked demand curve because firms will match price cuts of competitors -Control over both Q produced and P charged |
|
|
Oligopoly Strategy
|
Maintaining or enhancing market share, proper spending on advertising, and proper adaptation to price changes and changes in production volume
|
|
|
Describe Monopoly |
-No differentiation; sells only one product -One firm in the industry -No entry possible -Positive economic profits -Inelastic demand, downward sloping D curve -Control over price and quantity |
|
|
Monopoly Strategy
|
Ignore market share and focus on profitability from production levels that maximize profits
|
|
|
Porter's Five Forces
|
2) Market Competitiveness 3) Existence of Substitute Products 4) Bargaining Power of the Customers 5) Bargaining Power of the Suppliers |
|
|
Market Competitiveness Factors (Most Significant) |
1) Ability of Rival Firms to Respond to Change 2) Advertising of Rival Firms 3) Research and Development of Rival Firms 4) Alliances of Rival Firms and Suppliers *Stagnant market makes for higher competition |
|
|
Review Porter's Five Forces |
Page 52-54 |
|
|
Cost Leadership Strategies
|
-Match the Price of Rivals (More Profit through lower costs) |
|
|
Differentiation Strategies
|
-Increase Price (Profit through Revenue) |
|
|
Five Basic Types of Competitive Strategies
|
1) Cost leadership focused on a board range of buyers 2) Cost leadership focused on a narrow range (niche) of buyers 3) Differentiation focused on a broad range of buyers 4) Differentiation focused on a narrow range (niche) of buyers 5) Best cost provider |
|
|
When do Cost Leadership Strategies work and fail?
|
Works best when customers have large bargaining power and can switch between competitive products Fails when cutting costs so much that technological advances are overlooked that could help lower costs or overlook that consumers may want improvements. |
|
|
When do Differentiation Strategies work and fail?
|
Fails when cost outweighs the benefit to consumer or focus too much on one area (wrong area) |
|
|
When do Best Cost Strategies work and fail? |
Fails when company plays the middle |
|
|
Steps in Value Chain Analysis
|
1) Identify Value Activities 2) Identify Cost Drivers Associated with Each Activity 3) Develop a Competitive Advantage by Reducing Cost or Adding Value a. Identify Competitive Advantage b. Identify Opportunities for Added Value c. Identify Opportunities for Reduced Cost 4) Exploit Linkages Among Activities in the Value Chain |
|
|
Four Major Factors that Impact Global Competitive Advantage
|
1) Conditions of the Factors of Production 2) Conditions of Domestic Demand 3) Related and Supporting Industries 4) Firm Strategy, Structure, and Rivalry |
|
|
The Four Key Management Processes pertaining to SCOR
|
1) Plan - balance D and S within the goals and firm objectives and prepare infrastructure 2) Source - procure the resources required to meet it and to manage the infrastructure 3) Make - turn the raw materials into finished products to meet a planned demand 4) Deliver - getting the finished product to consumers to meet their planned demand |
|
|
Management Philosophies and Techniques for Performance Improvement
|
2) Quality (TQM) 3) Lean Manufacturing a. Kaizen - Continuous Improvement 4) Demand Flow 5) Theory of Constraints (TOC) |
|
|
Business Process Reengineering vs. Business Process Management
|
BPR seeks radical changes while BPM seeks incremental changes |
|
|
Examples of Conformance Costs
|
Prevention Costs (Prevent production of defective units) -Employee Training, Inspection Expenses, Preventative Maintenance, Product Redesign, Process Redesign, Search for Better Suppliers Appraisal Costs (Discover and remove defective parts before being shipped to customer or next department) -Statistical Quality Checks, Testing, Inspection, Maintenance of Lab |
|
|
Examples of Nonconformance Costs |
Internal Failure (Costs to cure a defect discovered before being shipped to customer) -Rework, Scrap, Tooling Changes, Costs to Dispose, Lost Unit Costs, Downtime External Failure (Costs to cure a defect after received by customer) -Warranty, Cost of Returning Good, Liability Claims, Lost Customers, Reengineering an External Failure |
|
|
What is Lean Manufacturing?
|
Using only those resources required to meet the requirements of customers. Focuses on waste reduction and efficiency.
|
|
|
What is Theory of Constraints (TOC)?
|
States that organizations are impeded from achieving objectives by the existence of one or more constraints
|
|
|
What are the Project Manager's responsibilities?
|
-Responsible for day-to-day project administration -Balancing project objectives with project constraints -Identify internal/external stakeholders -Develop, implement, monitor and control, and close the project plan -Communication project metrics to stakeholders and team members |
|
|
What are the Project Sponsor's responsibilities? |
-Responsible for providing resources and support and for overall project delivery -Chair steering committee and communicating project needs to the committee -High-level planning |
|
|
What are the methods used for estimated the cost of a project? |
-Judgment -Parametric Estimating; uses statistical relationships b/w historical cost and other factors -Analogous Estimating; similar sized projects -Work Breakdown Structure Estimation; bottom-up analysis -3-Point Estimate; realistic, optimistic, pessimistic -Vendor Bid Analysis -Reserve Analysis; allow for uncertain cost estimations -Earned Value Management |
|
|
Five phases of Project Management |
1) Initiating: scope defined, project authorized, resources committed 2) Planning: detail scope defined, project objectives refined, course of action defined, budget developed, project roles identified 3) Executing/Implementation: Work and QA performed, stakeholders expectation managed, vendor selected, project team assembled 4) Monitoring and Controlling; project status compared to baseline, 5) Closing |
|
|
Risk Assessment vs. Risk Control |
Risk Assessment anticipates everything that could go wrong, analyzes then prioritizes each risk. Risk Control could mean spending money to mitigate or prevent the most severe risks, planning for emergencies, tracking effects of identified risks in a risk register. |
|
|
What is the Scope Baseline?
|
A formally written approved statement of the project scope and work breakdown structure, outlining both the end product and the project scope. Describes project deliverables, amount of time to complete project, and attributes to be excluded. |
|
|
What are Repatriation restrictions?
|
These restrictions exist when a company invests money in a foreign company but is restricted from bringing that money back to its home country
|
|
|
What's the difference between Systemic and Functional Interdependence?
|
Functional interdependence refers to compliance with worldwide rule-making bodies such as UN, WTO, IMF. |
|
|
Factors that Drive Globalization |
1) Improvements in Transportation
2) Technological Advancements 3) Deregulation of International Financial Markets 4) Organizational/Operational Options for International Business |
|
|
Some facts about Globalization |
1) It's measured by world trade as a percentage of GDP 2) Globalization promotes specialization which produces a COMPARATIVE advantage |
|
|
Relevant Factors of Globalization that Affect a Company |
1) Political and Legal Influences 2) Potential Asset Expropriation 3) Taxes and Tariffs 4) Limitations on Asset Ownership or Joint Venture Participation 5) Content or Value Added Limits (Sourcing Requirements) 6) Foreign Trade Zones (Tariffs are waived until good leave the zone) 7) Economic Systems 8) Culture |
|
|
Inherent Risks of International Business Operations |
1) Exchange Rate Fluctuation: Transaction, Economic, and Translation Risk 2) Foreign Economies: carries the risk of functioning within the general health or weakness of a particular economy 3) Political Risk: Corruption, Bureaucracy, War, Inconvertibility of Foreign Currency |
|
|
What countries are considered Emerging Nations? |
Brazil, Russia, India, and China |
|
|
Describe Risk-Indifferent Behavior |
An increase in the level of risk does not result in an increase in Management's required rate of return |
|
|
Describe Risk-Averse Behavior |
An increase in the level of risk results in an increase in Management's required rate of return. Managers want higher expected returns to compensate for greater risk. |
|
|
Describe Risk-Seeking Behavior |
An increase in the level of risk results in a decrease in management's required rate of return. Managers are willing to settle for lower expected returns as the level of risk increases. |
|
|
Diversifiable Risk vs. Nondiversifiable Risk |
Diversifiable Risk (aka nonmarket, unsystematic, or firm-specific risk) is unique to a specific business Nondiversifiable Risk (aka market or systematic risk), which is the only relevant risk, impacts everyone, regardless of investment diversity |
|
|
Various Types of Risk |
1) Interest Rate increase causes decrease in value of a fixed rate bond 2) Market Risk: Market movement impacts individual stock in that market, i.e. NASDAQ increases and so does Microsoft 3) Credit Risk affects borrowers; Risk increases; borrower's IR increases 4) Default Risk affects lenders; Risk increases; borrower's IR increases 5) Liquidity Risk affects lenders (investors) when they want to sell their security, but can't do so in a timely manner or when material prices concessions have to be made to do so |
|
|
Effective Annual Percentage Rate |
[(1 + Stated Rate) ^ # of comp. periods] - 1 |
|
|
Simple Interest |
Principal x Interest Rate x # of Periods IR and Periods need to be apples-to-apples |
|
|
Compound Interest |
Principal x (1 + Interest Rate) ^ # of comp. periods IR and Periods need to be apples-to-apples |
|
|
Exchange Rate Risk Trade Factors |
-Relative Inflation Rates, i.e. Mexico wants more $ due to high inflation of peso to maintain purchasing power of their liquid resources causes the $ to be more valuable. -Relative Income Levels, i.e. US household income increases and wants to vacation in Mexico so they demand more peso making it more valuable. -Government Controls, i.e. Tariff on imports for Mexico helps stabilize peso |
|
|
Exchange Rate Risk Financial Factors |
-Relative Interest Rates; IR increases in Mexico relative to US IR rates. US investors increase their Mexican investments and the demand for pesos increases. Exchange rate increases as pesos command more US dollars -Capital Flows; The effect of IR is directly affected by the volume of capital that is allowed to flow between countries |
|
|
Exchange Rate Risk Exposure Categories |
1) Transaction Exposure - Economic loss or gain upon settlement of transactions as a result of changes in FX rate. 2) Economic Exposure - The present value of an organization's CF could increase or decrease as a result of changes in FX rate. 3) Translation Exposure - Parent company's A, L, E, or I will change due to change in FX rate. |
|
|
There are many Risk Management techniques for dealing with FX Rate Transaction Exposure. List and describe them. |
1) Futures Hedge - entitles holder to either purchase or sell a particular # of currency units for a negotiated price on a stated date 2) Forward Hedge - similar to a futures hedge but are typically for contracts between businesses and commercial banks and are larger transactions 3) Money Market Hedge - uses domestic currency to purchase a foreign currency at current spot rates and invest them in securities timed to mature at the same time as related payables 4) Currency Options Hedge - same principles as forwards and money market hedges but instead of requiring a commitment, it gives the option of executing the option contract or not, depending on which result is more favorable. |
|
|
Describe the AP and AR Application of a Futures and Forward Hedge |
AP: exposure occurs when the foreign currency strengthens. More domestic currency will be needed to purchase the foreign currency to settle the liability. Need hedge to buy the foreign currency at a specific rate on specific date. AR: exposure occurs when the domestic currency strengthens. Less domestic currency can be purchased with the foreign currency received. Need hedge to sell the foreign currency at a specific rate on specific date. |
|
|
Steps for using Money Market Hedges to satisfy payables |
1) Determine amount of payable 3) Discount the payable amount to the net investment required 4) Borrow funds domestically if no excess cash 5) Purchase the amount of foreign currency equal to net investment required and invest. |
|
|
Describe the AR Application of a Money Market Hedge |
Receivables denominated in foreign currencies effectively involves factoring receivables with foreign bank loans. Typically used when the domestic company needs the cash now and can't wait for customer to pay off receivable. Review page 49-50 |
|
|
Describe the AP and AR Application of a Currency Option Hedge |
Same as Forwards and Futures AP: Call option means option to Buy AR: Put option means option to Sell Review page 50-51 |
|
|
Techniques for Transaction Exposure Mitigation for Long-Term Transactions |
1) Long-Term Forward Contracts (Same as Forwards with Longer term) 2) Currency Swaps (2 firms with currency needs exchange at current rates) 3) Parallel Loan |
|
|
What are the rate characteristics, advantages, disadvantages, and strategy for Short-Term Debt? |
Rates of return: Lower Advantages: Increased liquidity and profitability Disadvantages: Increased interest rate risk and decreased capital availability Strategy: Use with higher levels of temporary working capital |
|
|
What are the rate characteristics, advantages, disadvantages, and strategy for Long-Term Debt? |
Rates of return: Higher Advantages: Decreased interest rate risk and credit risk and increased capital availability Disadvantages: Decreased liquidity and profitability Strategy: Use with higher levels of permanent working capital |
|
|
Describe the General Characteristics for both Debt and Equity Financing |
Debt Equity Flexibility No Yes Tax Deductibility Yes No EPS Dilution No Yes Increased Financial Risk Yes No Security Issuance Costs Low High Investor Return Fixed Variable |
|
|
Map IIA Standard to GAAS Standards |
1) Attribute Standards = General Standards; Covers auditor independence, technical proficiency, and professional care 2) Performance Standards = Field Work Standards; Covers planning and supervision of engagement and documentation of evidence 3) Implementation Standards only IIA, but covered in GAAS Attribute and Performance standards, covers the requirements of implemented both assurance and consulting activities |
|
|
What are the IIA Attribute Standards? |
1) Purpose, Authority, and Responsibility 2) Independence and Objectivity 3) Proficiency and Due Professional Care 4) Quality Assurance and Improvement Program |
|
|
What are the IIA Performance Standards? |
1) Managing the Internal Audit Activity 2) Nature of Work 3) Engagement Planning 4) Performing the Engagement 5) Communicating Results 6) Monitoring Progress 7) Management's Acceptance of Risk |
|
|
What are the standards used for benchmarking?
|
2) Currently Attainable Standards result from work performed with appropriate training and experience 3) Authoritative Standards set by management 4) Participative Standards set by management and employees |