![]()
![]()
![]()
Use LEFT and RIGHT arrow keys to navigate between flashcards;
Use UP and DOWN arrow keys to flip the card;
H to show hint;
A reads text to speech;
4 Cards in this Set
- Front
- Back
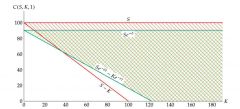
What does this graph describe? Explain the 4 lines. |
This graph shows the pricing of American an European Call options and the relationship between the two. The upper red line S=100 represents the maximum price an American option can cost (the current price of the underlying stock, if the American option were to be exercised today. Why would anyone pay for a call option that costs more than the stock?) The bottom red line C=S-K represents the minimum cost of an American call option. It cannot cost less than the exercise value of the option (meaning it cannot be cheaper than the immediate payoff if exercised today, or else people would buy the option for cheap and exercise it it today for a profit.) The upper green line represents the maximum cost of an European option. |
|
|
A |
B |
|
Which option is worth more and why? |
F |
|

Which option is worth more and why? |
The first one. |