![]()
![]()
![]()
Use LEFT and RIGHT arrow keys to navigate between flashcards;
Use UP and DOWN arrow keys to flip the card;
H to show hint;
A reads text to speech;
25 Cards in this Set
- Front
- Back
|
What is a Random Error |
These are fluctuations or variations in measurements that results from an experimenters' inability to take the measurement in exactly the same way to get the exact value |
|
|
How can an experimenter control random errors |
THEY CAN'T |
|
|
What are systematic errors |
These result from limitations in experimental techniques: poor choice of methods, fault in apparatus and inaccuracies in concentration of reagents |
|
|
Give one example of a systematic error |
Using a 0.1 molar concentration of a reagent when the accurate concentration Is 1.0 molar |
|
|
Give an example of a random error |
Not being able to read the meniscus at the same way each time |
|
|
Give one difference between a random and a systematic error |
A random error can vary from a positive to a negative throughout the measurements while a systematic error will either be positive or negative for each measurement |
|
|
What is Accuracy |
Accuracy refers to how close a measured value agrees with the correct or generally accepted value |
|
|
What is precision |
Precision refers to how closely individual measurements agree with each other when the measurement Is repeated |
|
|
What does precision indicate |
Precision is an indication of reproducibility |
|
|
What is the formula for mean |
UGH! |
|
|
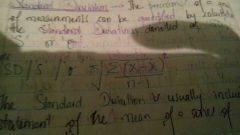
What is the purpose of standard deviation |
This is a means by which we can quantify the precision of a group of measurements |
|
|
What is the formula for standard deviation |
|
|
|
How is the mean of a set of values usually stated |
Example
60.73+-0.13 |
|
|
What is sensitivity of a measurement |
This is the ability of a method to discriminate against very small differences in measurements |
|
|
Sensitivity is also referred to as? |
Calibration sensitivity |
|
|
What does The slope of a calibration curve produce |
Calibration sensitivity |
|
|
What does the steepness of a calibration curve indicate |
The steeper the curve the more sensitive the method |
|
|
What is a blank |
This is an analysis of a sample without the Analyte, that Is, a sample that goes through the procedure with everything except the species being investigated |
|
|
Analysis of blanks are important because? |
-it helps to zero instruments -monitor quality control of reagents and check for contaminants -estimate detection limits |
|
|
Define detection limit |
This is the lowest concentration of an analyte that be detected at a know confidence level |
|
|
What causes interference? |
These are caused by substances that prevent the direct measurement of an analyte |
|
|
Chromophores |
This refers to the structural features of organic molecules which cause absorption of electromagnetic radiation of ultraviolet and visible wavelengths |
|
|
Auxochrome |
The group in colouring agents that may be attached to the Chromophores to modify their wavelengths and intensity of absorption |
|
|
What's the purpose of a spectrophotometer |
To quantitatively measure the amount of light absorbed by a solution |
|
|
Beer-Lambert law |
The degree of absorption at a given wavelength of an absorbing species in a non absorbing solvent depends on the concentration of the species and the path length of the radiation A = ęcl |