Reading...
![]()
Play button
![]()
Play button
![]()
Use LEFT and RIGHT arrow keys to navigate between flashcards;
Use UP and DOWN arrow keys to flip the card;
H to show hint;
A reads text to speech;
38 Cards in this Set
- Front
- Back
|
Spectroscopy:
|
the study of the interaction of energy w/ matter
- when energy is applied to matter, it can be absorbed, emitted, cause a chemical shift (change), or be transmitted. |
|
|
Chemical Shift:
|
the position of a signal along the x-axis of an NMR spectrum
- depends on the local magnetic environment of the nucleus producing the signal. (the local magnetic environment is influenced by e- density & other factors) |
|
|
What is the physical meaning of chemcial shift values?
|
relates to the actual frequency of the NMR signals produced by the nuclei
|
|
|
What is the practical importance of chemical shift information?
|
it gives important clues about molecular structure.
|
|
|
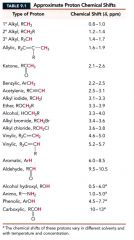
Table 9.1: Approximate Proton Chemical Shifts:
|
|
|
|
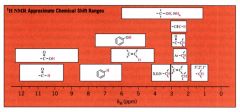
H-NMR Approximate Chemical Shift Ranges:
|
|
|
|
What does the integration of a signal area mean?
|
- the area under each signal in a H-NMR spectrum is proportional to the number of hydrogen atoms producing that signal.
- it represents the # of H atoms producing one signal as compared to the others. |
|
|
Signal Splitting (coupling):
|
is caused by the magnetic effect of nonequivlent H atoms that are w/in 2/3 bonds of the H's producing the signal.
|
|
|
What is a simple rule for predicting the # of peaks expected from adjacent coupling in H-NMR?
|
the # of peaks in a H-NMR signal from adjacent coupling is equal to n+1, where n is the # of adjacent H atoms that are nonequivalent to those producing the signal.
|
|
|
What are the 5 key aspects of an H-NMR spectra?
|
1. Count the # of signals to determine how many unique proton environments are in the molecule (neglecting, for the time being, the possibility of overlapping signals)
2. Use chemical shift tables or charts to correlate chemical shifts w/ possible structural environments 3. Determine the relative area of each signal, as compared w/ the area of other signals. as an indication of the relative # of protons producing the signal. 4. Interpret the splitting pattern for each signal to determine how many hydrogen atoms are present on C atoms adjacent to those producing the signal and sketch possible molecular fragments. 5. Joint the fragments to make a molecule in a fashion that is consistent w/ the data. |
|
|
What is the small magnetic field generated by the e's called?
|

an induced field (@ the proton, the induced magnetic field opposes the external magnetic field)
|
|
|
What does it mean when the e-s shield the proton?
|
that the actual magnetic field sensed by the proton is slightly less than the external field.
- a proton strongly shielded by electrons does not, of course, absorb at the same frequency as a proton that is less shielded b y e-s. - a shield proton will absorb at higher frequency. |
|
|
Two/ more protons that are identical environments have what kind of chemical shift?
|
the same chemical shift meaning it only gives 1 H-NMR signal.
|
|
|
How do we known when protons are in the same environment?
|
For most compounds, protons that are in the same environment are also equivalent in chemical reactions [chemically equivalent protons = chemical shift equivalent]
|
|
|
homotopic:
|

atoms or groups that are chemical shift equivalent
|
|
|
Enantiotopic:
|

hydrogen atoms that have the same chemical shift & give only 1 H-NMR signal
|
|
|
Diasterotopic:
|

protons that do not have the same chemical shift & give rise to different H-NMR signals.
|
|
|
Vicinal Coupling:
|
- coupling between H's on adjacent C.
- generally follows the n+1 rule. (except when diasterotopic H/ conformationally restricted sys. are involved) |
|
|
What causes signal splitting?
|
by the magnetic effect of protons that are nearby & nonequivalent to those protons producing a given signal.
|
|
|
In C-NMR what does each peak represent?
|
each unique carbon atom in an ordinary organic molecule produces only one peak.
|
|
|
C-NMR Approximate Chemical Shift Ranges:
|

|
|
|
Table 9.2: Approximate C(13) Chemical Shifts:
|

|
|
|
Characteristics of DEPT C-NMR spectrum:
|

CH2 are pointed down
CH, CH3 are pointed up quaternary C are not present. |
|
|
Mass Spectrometry (MS):
|

Involves formation of ions in a MS followed by separation & detection of the ions according to mass & charge.
- x-axis: -- represents the formula wts. of the detected ions ------- labeled m/z (m= mass, z= charge) -y-axis: -- represents the abundance of each detected ion. |
|
|
base peak:
|
the tallest peak in MS
|
|
|
Chain branching increases the likelihood of what in MS?
|
Chain branching increases the likelihood of cleavage at a branch point because a more stable carbocation can result.
|
|
|
Carbocations stabilize by resonance. What are several ways that resonance-stabilzied carbocations can be produced in MS:
|

|
|
|
The molecular ion peak of a primary or secondary alcohol is very small, with a tertiary alcohol it is usually undetectable, why?
|

Alcohols undergo rapid cleavage of a C-C bond next to O b/c this leads to a resonance stabilized cation.
- The cation obtained from the tertiary alcohol is the most stable b/c of the e- releasing R group. |
|
|
When the breaking of two covalent bonds occurs, a radical cation undergoing this type of fragmentation results in what? What are some important examples?
|

The products are a new radical cation and a neutral molecule.
|
|
|
Which molecules have an isotope w/ one mass unit greater than the most common isotope?
|
C, H, N
|
|
|
Which molecules have an isotope w/ two mass unit greater than the most common isotope?
|
O, S, Br, Cl
|
|
|
Table 9.4: Principle Stable Isotopes of Common Elements:
|

|
|
|
Guide to determine the molecular formula from a MS:
|

|
|
|
compounds w/ nearly equal peaks 2 m/z apart most likely contains what atom?
|
Br
|
|
|
GC/MS analysis:
|

- gas chromatograph separates components of a mixture, mass spectrometer then gives structural info. about each one.
- provides quantitative data when standards of known concentration are used w/ the unknown. |
|
|
Concept map: H-NMR Spectroscopy:
|

|
|
|
Concept Map: C-NMR spectroscopy:
|

|
|
|
Concept Map: Mass Spectroscopy
|

|