Reading...
![]()
Play button
![]()
Play button
![]()
Use LEFT and RIGHT arrow keys to navigate between flashcards;
Use UP and DOWN arrow keys to flip the card;
H to show hint;
A reads text to speech;
16 Cards in this Set
- Front
- Back
|
A feature of a chart used to plot data.
|
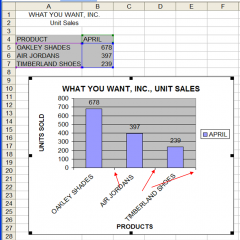
Graph |
|
|
The total package that includes: titles, values, axis labels, legend information, color and adds meaning to the graph
|
Chart |
|
|
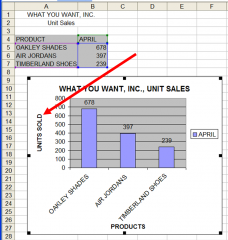
Left vertical side of the graph. |
Y-Axis |
|
|
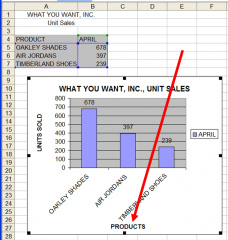
The bottom horizontal side of the graph.
|
X-Axis |
|
|
Used in a graph to indicate data values.
|
Data Markers |
|
|
A collection of related values, such as one row or one column from a spreadsheet.
|
Data Series
|
|
|
Horizontal or vertica lline that extends across the plot area of the graph for the purpose of adding clarification to the data.
|
Gridline |
|
|
The backgroundportion of a graph.
|
Plot Area |
|
|
Used in a graph to clarify the data categories or values.
|
Tick Marks |
|
|
An object that explains the symbols, colors, or patterns used to differentiate the data.
|
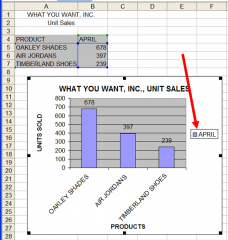
Legend |
|
|
Is a single value or text explanation used to explain the data in a series.
|
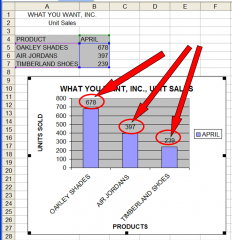
Data Label |
|
|
The main heading, which describes the purpose and content ofthe chart.
|
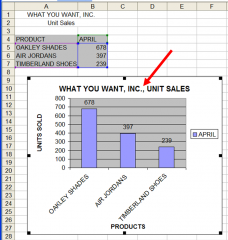
Chart Title |
|
|
Describes the Y-axis, which is the vertical data.
|
Y-Axis Title |
|
|
Describes the X-axis, which is the horizontal data.
|
X-Axis Title |
|
|
A Chart that appears on the samesheet as the spreadsheet/worksheet it represents. |
Embedded Chart |
|
|
A chart that will change to reflect changes made to the spreadsheet it represents. |
Linked Chart |