Reading...
![]()
Play button
![]()
Play button
![]()
Use LEFT and RIGHT arrow keys to navigate between flashcards;
Use UP and DOWN arrow keys to flip the card;
H to show hint;
A reads text to speech;
80 Cards in this Set
- Front
- Back
|
Welfare Economics is the study of how
|
the allocation of resources affects economic well-being
|
|
|
The maximum price that a buyer will pay for a good is called the
|
willingness to pay
|
|
|
A consumer's willingness to pay directly measures
|
how much a buyer values a good
|
|
|
Consumer surplus
|
is measured using the demand curve for a product
|
|
|
Consumer Surplus is
|
the amount a buyer is willing to pay for a good minus the amount the buyer actually pays for it
|
|
|
On a graph, the area below a demand curve and above the price measures
|
consumer surplus
|
|

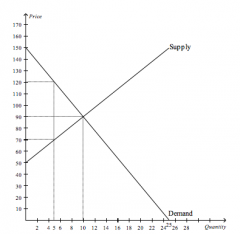
Refer to the figure above.
If the price of the product is $15.00, then who would be willing to purchase the product? |
Zach, Audrey, and Lori
|
|

Refer to the figure above.
If the price of the product is $22.00, then who would be willing to purchase the product? |
Audrey and Lori
|
|

Refer to the figure above.
If the price of the product is $51.00, then who would be willing to purchase the product? |
no one
|
|

Refer to the figure above.
If the price of the product is $18.00, then the total consumer surplus is |
$46.00
|
|
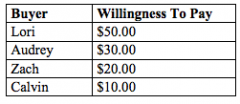
Refer to the figure above.
If the price of the product is $30.00, then the total consumer surplus is |
$20.00
|
|
|
Brock is willing to pay $400 for a new suit, but he is able to buy the suit for $350. His consumer surplus is
|
$50.00
|
|
|
Suppose Katie, Kendra, and Kristen each purchase a particular type of cell phone at a price of $80. Katie's willingness to pay was $100, Kendra's willingness to pay was $95, and Kristen's willingness to pay was $80. Which of the following statements is correct?
a. for the three individuals together, consumer surplus amounts to $35.00 b. Having bought the cell phone, Kristen is better off than she would have been had she not bought it c. Had the price of the cellphone been $95 rather than $80, Katie and Kendra definitely would have been buyers and Kristen definitely would not have been a buyer d. The fact that all three individuals paid $80 for the same type of cell phone indicates that each one placed the same value on that cell phone |
a. for the three individuals together, consumer surplus amounts to $35.00
|
|

Refer to the figure above.
If the price of the good is $250.00, then consumer surplus amounts to |
$50.00
|
|

Refer to the figure above.
If the price of the good is $150.00, then consumer surplus amounts to |
$250.00
|
|

Refer to the figure above.
If the price of the good is $50.00, then consumer surplus amounts to |
$600.00
|
|
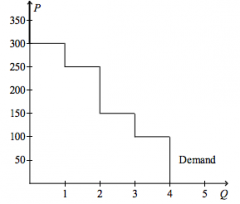
Refer to the figure above.
If the price of the good is $60.00, then |
consumer surplus is $150.00
|
|

Refer to the figure above.
If the price of the good is $200, then |
consumer surplus is $150.00
|
|

Refer to the figure above.
The value of the good to consumers minus the cost of the good to consumers amounts to $325 if the price of the good is |
$125.00
|
|

Refer to the figure above.
When the price is P1, consumer surplus is |
A+B+C
|
|
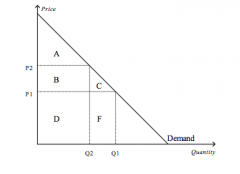
Refer to the figure above.
When the price is P2, consumer surplus is |
A
|
|

Refer to the figure above.
When the price rises from P1 to P2, consumer surplus |
decrease by an amount equal to B+C
|
|

Refer to the figure above.
Area C represents |
consumer surplus to new customers who enter the market when the price falls from P2 to P1
|
|
Refer to the figure above.
When the price rises from P1 to P2, which of the following statements is not true? a. The buyers who still buy the good are worse off because they now pay more b. Some buyers leave the market because they are not willing to buy the good at the higher price c. Buyers place a higher value on the good after the price increase d. Consumer surplus in the market falls |
c. Buyers place a higher value on the good after the price increase
|
|
Refer to the figure above.
At the equilibrium price, consumer surplus is |
$300.00
|
|

Refer to the figure above.
If the government imposes a price floor of $120.00 in this market, then consumer surplus will decrease by |
$225.00
|
|

Refer to the figure above.
What is the consumer surplus if the price is $100.00? |
$2,500
|
|
Refer to the figure above.
What happens to the consumer surplus if the price rises from $100 to $150? |
The new consumer surplus is 25% of the original consumer surplus
|
|
|
A seller's opportunity cost measures the
|
value of everything she must give up to produce a good
|
|
|
Cost is a measure of
|
seller's willingness to sell
|
|
|
A supply curve can be used to measure producer surplus because it reflects
|
sellers' costs
|
|
|
Producer Surplus is
|
the amount a seller is paid minus the cost of production
|
|
|
Tom tunes pianos in his spare time for extra income. Buyers of his service are willing to pay $155 per tuning. One particular week, Tom is willing to tune the first piano for $120, the second piano for $125, the third piano for $140, and the fourth piano for $160. Assume Tom is rational in deciding how many pianos to tune. His producer surplus is
|
$80.00
|
|
|
David tunes pianos in his spare time for extra income. Buyers of his service are willing to pay $135 per tuning. One particular week, David is willing to tune the first piano for $115, the second piano for $125, the third piano for $140, and the fourth piano for $175. Assume David is rational in deciding how many pianos to tune. His producer surplus is
|
$30.00
|
|

Refer to the figure above.
If the market price is $1,000, the producer surplus in the market is |
$750.00
|
|

Refer to the figure above.
If the market price is $900, the producer surplus in the market is |
$550.00
|
|

Refer to the figure above.
If the market price is $1,100, the combined total cost of all participating sellers is |
$2,250
|
|

Refer to the figure above.
If the price is $1,000, |
Dianne is an eager seller
|
|

Refer to the figure above.
If the price is $775, who would be willing to supply the product? |
Dianne and Evalina
|
|

Refer to the figure above.
Suppose each of the five sellers can supply at most one unit of the good. The market quantity supplied is exactly 3 if the price is |
$1,170
|
|

Refer to the figure above.
Suppose each of the five sellers can supply at most one unit of the good. The market quantity supplied is exactly 4 if the price is |
$1,370
|
|
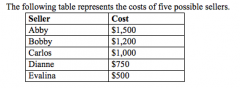
Refer to the figure above.
Who is a marginal seller when the price is $1,200 |
Bobby
|
|
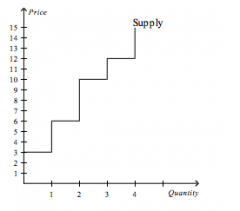
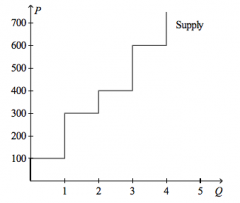
Refer to the figure above.
If the price of the good is $9.50, then producer surplus is |
$10.00
|
|

Refer to the figure above.
If the price of the good is $14, then producer surplus is |
$25.00
|
|

Refer to the figure above.
If producer surplus is $14, then the price of the good is |
$11.00
|
|
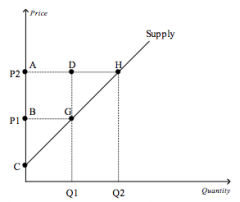
Refer to the figure above.
Which area represents producer surplus when the price is P1? |
BCG
|
|

Refer to the figure above.
Which area represents producer surplus when the price is P2? |
ACH
|
|

Refer to the figure above.
Which area represents the increase in producer surplus when the price rises from P1 to P2? |
AHGB
|
|

Refer to the figure above.
When the price rises from P1 to P2, which area represents the increase in producer surplus to existing producers |
ABGD
|
|

Refer to the figure above.
Which area represents the increase in producer surplus when the price rises from P1 to P2 due to new producers entering the market? |
DGH
|
|
Refer to the figure above.
At the equilibrium price, producer surplus is |
$200
|
|

Refer to the figure above.
If the government imposes a price ceiling of $70 in this market, then the new producer surplus will be |
$50
|
|

Refer to the figure above.
If the government imposes a price ceiling of $70 in this market, then the producer surplus will decrease by |
$50
|
|
Refer to the figure above.
If the price of the good is $300, then producer surplus amounts to |
$200
|
|

Refer to the figure above.
If the price of the good is $500, then producer surplus amounts to |
$700
|
|

Refer to the figure above.
If the price of the good is $600, then producer surplus amounts to |
$1,000
|
|

Refer to the figure above.
If the price of the good is $600, then |
producer surplus is $1,000
|
|

Refer to the figure above.
Suppose the price of the good is $400. Then, on the first unit of the good that is sold, producer surplus amounts to |
$300
|
|

Refer to the figure above.
Suppose the price of the good is $400. Then, on the first unit of the good that is sold, producer surplus is |
$350, and on the second unit of the good that is sold, the producer surplus is $150
|
|

Refer to the figure above.
Producer surplus amounts to $300 if the price of the good is |
$350
|
|

Refer to the figure above.
Sellers will be unwilling to sell more than |
1 unit of the good its its price is below $200
|
|
|
What tools allow economists to determine if the allocation of resources determined by free markets is desirable?
|
consumer and producer surplus
|
|
|
Economists typically measure efficiency using
|
total surplus
|
|
|
Total Surplus
|
can be used to measure a market's efficiency, is the sum of consumer and producer surplus, and is the value to buyers minus the cost to selelrs
|
|
|
Total Surplus is
|
the total value of the good to buyers minus the cost to sellers of providing the good
|
|
|
Total Surplus is
|
equal to producer surplus plus consumer surplus
|
|
|
Efficiency in a market is achieved when
|
the sum of producer surplus and consumer surplus is maximized
|
|

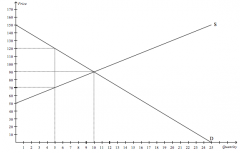
Refer to the figure above.
At the equilibrium price, consumer surplus is |
$150
|
|

Refer to the figure above.
At the equilibrium price, producer surplus is |
$100
|
|
Refer to the figure above.
At the equilibrium price, total surplus is |
$250
|
|

Refer to the figure above.
If the government imposes a price ceiling of $60 in this market, then total surplus will be |
$250
|
|

Refer to the figure above.
If the government imposes a price floor of $60 in this market, then total surplus will be |
lower by $62.50 than it would be without the price floor
|
|

Refer to the figure above.
If the government imposes a price floor of $60 in this market, then total surplus will be |
$187.50
|
|

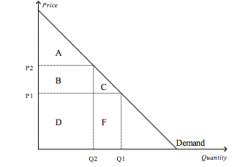
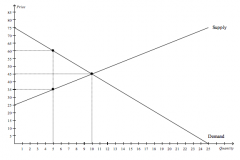
Refer to the figure above.
The equilibrium price is |
P2
|
|

Refer to the figure above.
At equilibrium, consumer surplus is represented by the area |
A+B+C
|
|

Refer to the figure above.
If the price were P3, consumer surplus would be represented by the area |
A
|
|

Refer to the figure above.
At equilibrium, producer surplus is represented by the area |
D+H+F
|
|

Refer to the figure above.
If the price were P1, producer surplus would be represented by the area |
F
|
|
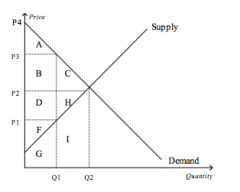
Refer to the figure above.
At equilibrium, total surplus is represented by the area |
A+B+C+D+H+F
|
|

Refer to the figure above.
The efficient price-quantity combination is |
P2 and Q2
|