![]()
![]()
![]()
Use LEFT and RIGHT arrow keys to navigate between flashcards;
Use UP and DOWN arrow keys to flip the card;
H to show hint;
A reads text to speech;
62 Cards in this Set
- Front
- Back
|
Frequency Distribution |
A table in which all of the scores are listed along with the frequency with which each occurs. |
|
|
Qualitative Variable |
a categorical variable for which each value represents a discrete category. |
|
|
Quantitative Variable |
a variable for which the scores represent a change in quantity. |
|
|
Do a frequency table for 5,4,4,3,3,3,2,2,2,1 |
Try it now GO ! |
|
|
Class Interval Frequency Distribution |
When the number of categories is very large, they are combined, or grouped, in the table. |
|
|
How do you do an Interval Frequency Distribution ? |
Individuals scores are combined into categories, or intervals and then listed along the frequency of scores in each interval. |
|
|
Graphs |
1. Bar graphs 2. Histograms 3. Frequency of polygons. |
|
|
Creating a Histogram |
1. List all the numeric scores on the X axis. 2. Y Axis should be the frequency of scores. |
|
|
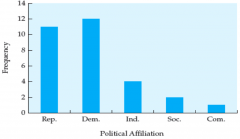
Bar Graph |
|
|
|
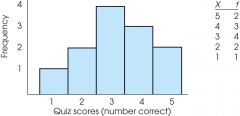
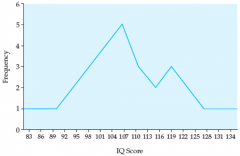
Frequency Distribution Histogram |
|
|
|
Histogram |
|
|
|
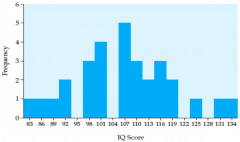
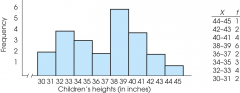
Frequency Distribution Histogram for Grouped Data |
|
|
|
Frequency Polygon |
|
|
|
Descriptive Statistics |
Numerical measures that describe a distribution by providing: 1. Information on the central tendency of the distribution. 2. The width of the distribution 3. The shape of the distribution, |
|
|
What are the characteristics of descriptive statistics? |
1. Information on the central tendency of the distribution, 2. The width of the distribution, 3. The shape of the distribution, |
|
|
Measure of central tendency |
a number that characterizes the "middleness" of an entire distribution. |
|
|
Types of measures of central tendency |
1. Mean 2. Median 3. Mode |
|
|
Mean |
The average Sum of scores / the amount of scores. Used with interval and ration data |
|
|
Median |
The middle score in a distribution of scores organized from highest to lowest or vice-versa. Used with Ordinal, Interval, and ratio data. |
|
|
Mode |
The score occurring with the greatest frequency. Nominal, ordinal, interval, or ratio data. Not a reliable measure of central tendency. |
|
|
µ |
Population mean = ∑x / N |
|
|
x̅ |
Sample mean = ∑x / N |
|
|
What is the median of 3, 5, 8, 10, 11 |
Median = 8 |
|
|
Distribution of even numbers, 3, 3, 4, 5, 7, 8 |
4+5/2 = 9/2 = 4.5 |
|
|
Bimodal Distribution |
Major and Minor Modes. |
|
|
Find mean, median, and mode for the following data: 5, 15, 10, 15, 5, 10, 10, 20, 25, 15 |
Mean : 13 Median: 12.5 Mode: Major = 15 Minor =10 |
|
|
Variability |
A quantitative measure of the differences between scores. |
|
|
Purposes of Measure of Variability |
1. Describes the distribution 2. Measure how well an individual score represents the distribution. |
|
|
What are three measures of variability |
1. The Range 2. The standard deviation 3. The Variance |
|
|
The range |
The distance covered by the scores in a distribution. Measured from smallest value to highest value. |
|
|
Formula for Range |
range = URL for Xmax — LRL for Xmin |
|
|
Standard Deviation and Variance for a population |
Most common and most important measure of variability. Describes whether the scores are clustered closely around the mean or widely scattered. |
|
|
Deviation |
is the distance from the mean Deviationscore = X — μ |
|
|
What is the deviation score if µ = 50 and x = 45 |
Deviationscore = X — μ Deviationscore = 45 — 50 Deviationscore = X — 5 |
|
|
Mean of Deviations |
X -- µ = should equal 0 Then take the mean of those scores. |
|
|
Variance is |
the average squared distance from the mean. Average of the squared deviations |
|
|
Formula for variance |
σ² = Σ (X –μ) ² / N |
|
|
Standard Deviation |
= Square root of Variance |
|
|
μ = |
population mean
|
|
|
σ =
|
standard deviation
|
|
|
σ2 =
|
variance
|
|
|
SS =
|
sum of squares
|
|
|
Practice the Formula on Slide 45 |
Do IT !!! |
|
|
Normal Curve |
a symmetrical, bell-shaped frequency polygon representing a normal distribution, |
|
|
Normal distribution |
a theoretical frequency distribution that has certain special characteristics. |
|
|
Kurtosis |
how flat of peaked a normal distribution is |
|
|
Mesokuritc |
Normal curves that have peaks of medium height and distributions that are moderate in breadth. |
|
|
Leptokurtic |
Normal curves that are tall and thin, with only a few scores in the middle of the distribution having a high frequency. |
|
|
Platykurtic |
Normal curves that are short and more dispersed. |
|
|
Postive Skew |
Tail on the right. |
|
|
Negative Skew |
Tail on the left. |
|
|
Purpose of Z-Scores |
Identify and describe the location of every score in the distribution. Standardizes an entire distribution |
|
|
The location is described by z-score |
Sign + or - tells whether the score is located above or below the mean. Number tells the distance between score and mean in standard deviation units. |
|
|
Z-score = +1 |
1 Standard deviation above the mean. |
|
|
Z-score (Standard Score) |
a number that indicates how many standard deviation units a raw score is from the mean of a distribution. |
|
|
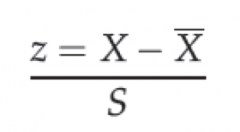
Z score for Sample |
|
|
|
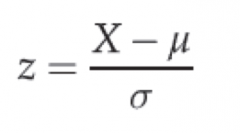
z score for Population |
|
|
|
Practice calculting |
raw score from z score. |
|
|
Practice calculating |
µ from z score. |
|
|
Probability |
the expected relative frequency of a particular outcome. |
|
|
Area between Mean and Z |
area under the curve between the mean of the distribution, and the z score with which you are working. |
|
|
Area beyond Z |
area under the curve from the z-score out to the tail end of the distribution. |