Reading...
![]()
Play button
![]()
Play button
![]()
Use LEFT and RIGHT arrow keys to navigate between flashcards;
Use UP and DOWN arrow keys to flip the card;
H to show hint;
A reads text to speech;
14 Cards in this Set
- Front
- Back
Define Chapter 5 Concepts
|
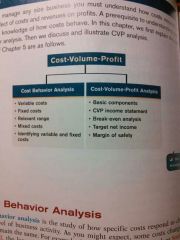
Cost behavior analysis -
variable costs - fixed costs - Relevant range - mixed costs - identifying variable and fixed costs - COST-VOLUME-PROFIT ANALYSIS - basic components - CVP income statement - Break - even analysis - target net income - margin of safety - |
|
|
Cost behavior analysis
|
The study of how specific costs respond to changes in the level of business activity.
- some cost change others remain the same - helps management plan operations and decide between alternative courses of action. - applies to all types of businesses and entities. - starting point is measuring key business activities. - many companies use more than one measurement base. - activity levels may be expressed in terms of sales dollars in a retail company miles driven in a trucking company room occupancy in a hotel dance classes taught by a dance studio - changes in the level or volume of activity should be correlated with changes in cost activity level selected is called activity or volume index activity index - identifies the activity that causes changes in the behavior of costs - allows costs to be classified as variable fixed or mixed. |
|
Variable costs
|
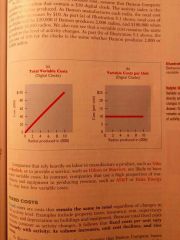
Cost that vary in total directly and proportionately to changes in the activity level
ex - activity level +10% = total variable cost + 10 % Variable costs remain the same per unit at every level of activity. |
|
Fixed costs
|
Cost that remain the same in total regardless of changes in the activity level.
per unit cost varies inversely with activity ; as volume increases unit cost declines and vice versa Ex - property taxes, insurance, rent, depreciation on building and equipment. |
|

Relevant range
|
Range of activity over which a company expects to operate during a year
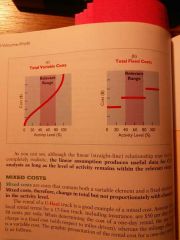
Although the linear straight line relationship may not be completely realistic the linear assumption produces useful data for CVP analysis as long as the level activity remains within the relevant range. In most business situations a straight-line relationship does not exist for variable or fixed costs throughout the entire range of possible activity abnormally low levels activity it may be impossible to be cost efficient as a result in the real world the relationship between the behavior of a variable cost and changes in the activity level is often curvilinear . in curved sections of the line a change in the activity index will not result in a direct proportional change in the variable cost. |
|
Mixed costs
|
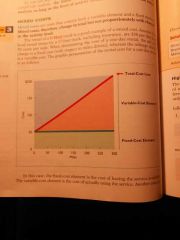
Cost to have both a variable cost element and a fixed cost element
change in total but not proportionately with changes in activity level For purposes of CVP analysis mixed costs must be classified into their fixed and variable elements one method of doing so is called the high - low method other methods include the scatter diagram method and least-squares regression analysis |
|
|
High-low method
|
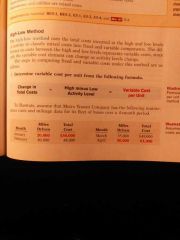
Step 1 Change in total costs / high - low activity level = variable cost per unit
Step 2 fixed cost = total cost @ high/low activity level - Total variable cost Cost to produce units(x) = (variable cost per unit x units(y)) + fixed costs Mixed costs must be classified into their fixed and variable elements uses the total costs incurred at both the high and low levels of activity to classify mixed costs the difference in cost between the high and low levels represents variable costs since only variable cost change as activity level changes |
|
|
Cost-volume-profit analysis
|
The study of the effects of changes of costs and volume on a company's profits
- important in profit planning - critical factor in management decisions as setting selling prices, determining product mix, and maximizing use of production facilities. Basic components include - activity level - unit selling prices - variable cost per unit - total fixed cost - sales mix |
|
|
Cost-volume-profit income statement
|
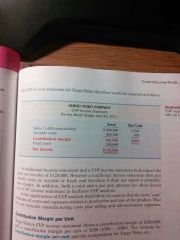
- a statement for internal use.
- classifies costs and expenses as fixed or variable. enter - reports contribution margin in the body of the statement. - contribution margin - amount of revenue remaining after deducting variable costs, reports the same net income as traditional income statement. |
|
|
Contribution margin per unit
|
Contribution margin per unit = unit selling price - unit variable costs
Contribution margin is available to cover fixed costs and to contribute to income |
|
|
Contribution margin ratio
|
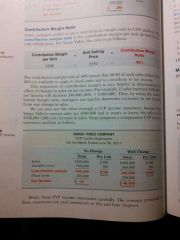
Contribution margin ratio = contribution margin per unit / unit selling price
Shows the percentage of each sales dollar available to apply towards fixed costs and profit. |
|
|
Break - even analysis
|
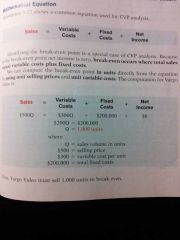
Process of finding the break-even point level of activity at which total revenues equal total costs
Expressed either in sales units or in sales dollars - can be computed or derived from a mathematical equation, by contribution margin, or from a cost volume profit graph. Math method Sales = variable costs + fixed costs + net income(break even occurs @$0 net income) contribution margin method Break even point In units = fixed costs / contribution margin per unit Break even point in dollars = fixed costs / contribution margin ratio graphic presentation method Cost volume profit graph(break even graph) - includes costs, volume, and profits. |
|
|
Target net income
|

Target net income = required sales - variable costs - fixed costs
Contribution margin method Required sales in units = fixed costs + target net income / contribution margin per unit Required sales in dollars = fixed cost + target net income / contribution margin ratio Level of sales necessary to achieve a specified income. Expressed either in sales units or in sales dollars Can be determined for each of the approaches used to determine break even sales / units math equation, contribution margin, CVP graph |
|
|
Margin of safety
|
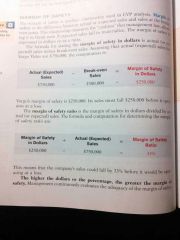
Margin of safety in dollars = annual (expected) sales - break-even sales
Margin of safety ratio = margin of safety in dollars / annual expected sales Difference between actual or expected sales and sales at the break-even point. Measures the cushion that management has if expected sales fail to materialize. May be expressed in dollars or as a ratio The higher the dollars or percentage the greater the margin of safety. |