Reading...
![]()
Play button
![]()
Play button
![]()
Use LEFT and RIGHT arrow keys to navigate between flashcards;
Use UP and DOWN arrow keys to flip the card;
H to show hint;
A reads text to speech;
119 Cards in this Set
- Front
- Back
|
1
|
|
|
2
|
|
|
3
|
|
|
4
|
|
|
5
|
|
|
6
|
|
|
7
|
|
|
8
|
|
|
9
|
|
|
10
|
|
|
11
|
|
|
12
|
|
|
13
|
|
|
14
|
|
|
15
|
|
|
16
|
|
|
17
|
|
|
18
|
|
|
19
|
|
|
20
|
|
|
21
|
|
|
22
|
|
|
23
|
|
|
24
|
|
|
25
|
|
|
26
|
|
|
27
|
|
|
28
|
|
|
29
|
|
|
30
|
|
|
31
|
|
|
32
|
|
|
33
|
|
|
34
|
|
|
35
|
|
|
36
|
|
|
37
|
|
|
38
|
|
|
39
|
|
|
40
|
|
|
41
|
|
|
42
|
|
|
43
|
|
|
44
|
|
|
45
|
|
|
46
|
|
|
47
|
|
|
48
|
|
|
49
|
|
|
50
|
|
|
51
|
|
|
52
|
|
|
53
|
|
|
54
|
|
|
55
|
|
|
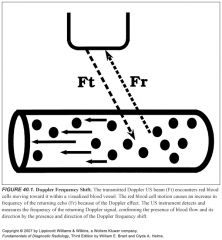
Explain Doppler shift:
|
-Doppler shift is the change in frequency between the US waves emitted by the transducer and the US waves returning to the transducer after reflection from moving RBCs.
-This shift in sound frequency results from the Doppler effect. -The reflected sound frequency increases when blood flow direction is toward the Doppler signal and decreases when the direction is away from the Doppler signal. -An increase in frequency is termed a positive Doppler shift; the sound waves are compressed by encountering RBCs moving toward the sound source. -A decrease in frequency is termed a negative Doppler shift, because the reflected sound waves are stretched by RBCs moving away from the sound source. -The presence of a Doppler shift within a blood vessel confirms the presence of blood flow. -The direction of the Doppler shift toward higher or lower frequency indicates the direction of blood flow. -Doppler shift frequencies are within the range of human hearing and produce distinctive audible sound patterns that characterize normal and abnormal arterial and venous blood flow. |
|
|
What factors affect the magnitude of the Doppler shift?
|
The frequency shift (ΔF) is proportional to the following:
(1) the velocity (V) of the moving RBCs (2) the frequency of the transmitted Doppler US beam (Ft) (3) the cosine of the angle between the incident Doppler US beam and the direction of blood flow. |
|
|
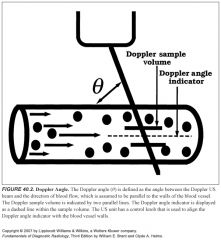
How could you angle your transducer relative to a blood vessel to get the most Doppler shift?
|
First, the largest frequency shift—that is, the largest Doppler signal—will be obtained when the Doppler US beam is directed straight down the barrel of the vessel (θ = 0°, cosine 0° = 1).
|
|
|
How could you angle your transducer relative to a blood vessel to get absolutely no Doppler shift, regardless of bloodflow?
|
No Doppler shift will occur when the Doppler US beam is directly perpendicular to blood flow (θ = 90°, cosine 90° = 0).
|
|
|
What is the optimal angle between your transducer and the imaged blood vessel?
|
As a general rule, Doppler scanning should be performed to keep Doppler angles at 60° or less.
|
|
|
How does the machine know what angle your transducer is making with a blood vessel?
|
The operator communicates the Doppler angle to the US unit by aligning the Doppler angle “wings” to be parallel with the walls of the vessels examined
|
|
|
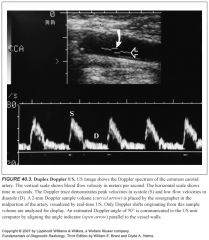
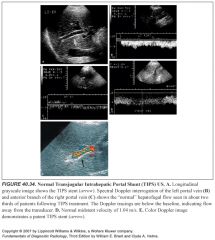
What is duplex ultrasound?
|
Simultaneous grayscale imaging plus Doppler scanning is called duplex US. Both spectral and color Doppler imaging are examples of duplex imaging.
|
|
|
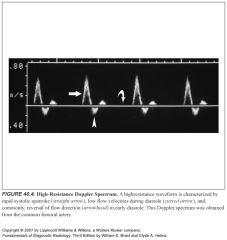
Describe a high resistance arterial waveform:
|
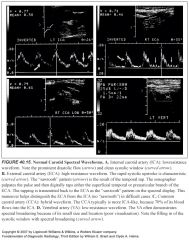
-High-resistance spectral waveforms are characterized by velocities that increase sharply with systole, decrease rapidly with cessation of ventricular contraction, and show little or no forward flow during diastole.
-Blood flow direction may reverse briefly during early diastole, producing a triphasic waveform. -Arteries can be either high or low resistance |
|
|
What arteries demonstrate a high resistance waveform under normal conditions?
|
Arteries that normally show a high-resistance Doppler waveform include arteries that supply primarily skeletal muscle at rest, including the iliac, femoral, popliteal, subclavian, and brachial arteries. The external carotid artery waveform is relatively high resistance in appearance.
|
|
|
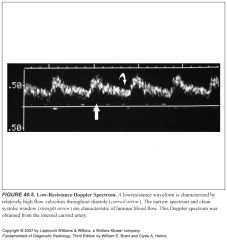
Describe a low resistance arterial waveform:
|
-Low-resistance spectral waveforms are characterized by a slower increase in flow velocity with onset of systole and a gradual decrease in velocity during diastole, with continued forward flow throughout the cardiac cycle
|
|
|
What arteries normally have low resistance waveforms?
|
-Arteries that supply vital organs characteristically have a low-resistance waveform.
-These include the internal carotid, hepatic, and renal arteries. -The common carotid artery, with 70% of its blood flow going to the internal carotid artery, has a low-resistance spectral waveform. |
|
|
What type of spectral waveform does the SMA demonstrate?
|
The superior mesenteric artery waveform has a high-resistance pattern during fasting and a low-resistance pattern after eating, reflecting the opening of intestinal tract arterioles and increased intestinal blood flow induced by food in the gut.
|
|
|
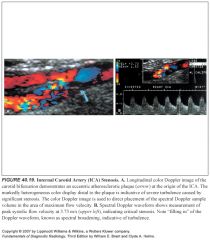
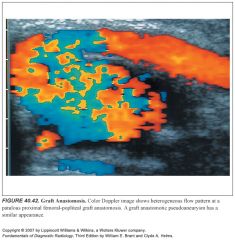
What signs on spectral Doppler tell you that bloodflow is disturbed (not laminar)?
|
-Characteristic spectral Doppler signs of disturbed blood flow are:
1. Increased velocity 2. Spectral broadening 3. Simultaneous forward and reverse flow 4. Fluctuations of flow velocity with time -Turbulent and disturbed spectral waveforms are usually, but not always, indicative of pathologic changes in blood flow. -Disturbed blood flow is a loss of the normal orderly laminar flow pattern. |
|
|
What is spectral broadening?
|
-Spectral broadening is widening of the spectral waveform that reflects a broader range of flow velocities within the Doppler sample volume.
-Spectral broadening increases with the severity of flow disturbance. -However, normal spectral broadening occurs when the size of the Doppler sample volume is large compared to the size of the vessel, or when the sample volume is placed near the vessel wall instead of midlumen. |
|
|
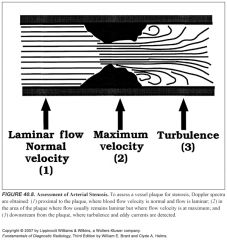
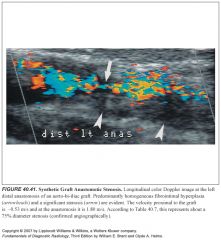
Where is bloodflow most turbulent in relation to a stenosis?
|
Turbulence is most pronounced just downstream from a severe vessel stenosis, where eddy currents are produced as the high-velocity flow slows and occupies a larger vessel area.
|
|
|
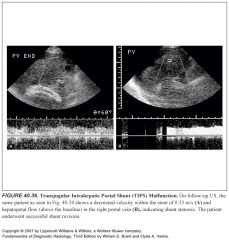
Where are spectral Doppler waveforms sampled relative to a stenosis? What do they show?
|
-To assess the degree of stenosis, Doppler spectra are routinely obtained in three areas of the vessel lumen: (1) proximal to stenosis, (2) at the point of maximal stenosis, and (3) 1 to 2 cm downstream from the stenosis.
-Laminar flow is generally present proximal to the stenosis. -Within the stenotic zone, velocity is increased but usually remains laminar. -The severity of stenosis correlates best with the highest blood flow velocity during peak systole. -The highest velocity may be in a very small region, and a careful search of the vessel is necessary. -In the poststenotic zone, flow spreads out, causing turbulence and eddy currents to occur and produce broadening of the Doppler spectrum. -Downstream from severe stenosis (>50%) the Doppler signals are dampened, producing the parvus-tardus waveform. -Flow velocities are low (parvus) with a slow systolic upstroke (tardus) |
|
|
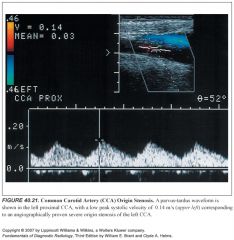
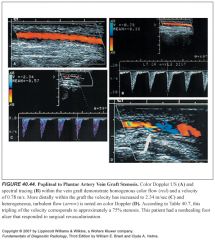
What is a parvus-tardus waveform? What does it indicate?
|
-Downstream from severe stenosis (>50%) the Doppler signals are dampened, producing the parvus-tardus waveform.
-Flow velocities are low (parvus) with a slow systolic upstroke (tardus) |
|
|
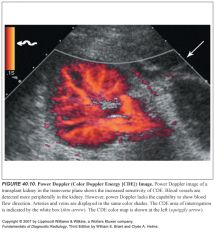
How is power Doppler different from color Doppler?
|
-Power Doppler displays information more directly related to the number of moving RBCs than to their velocity.
-Power Doppler is relatively angle independent and is more sensitive to slow flow than color Doppler. |
|
|
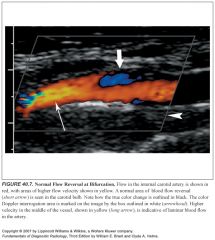
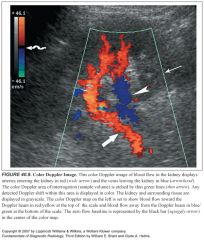
What do the different colors usually mean on color Doppler?
|
On the color Doppler, image flow directed toward the transducer is usually colored red, whereas flow away from the transducer is usually colored blue. Of course, you can reverse this if you want.
|
|
|
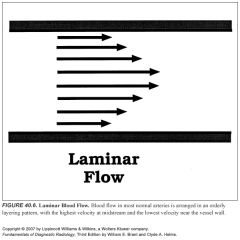
What does laminar flow look like on color Doppler? What about turbulent flow?
|
-A normal laminar flow pattern will demonstrate lighter shades in the midstream and darker shades near the vessel walls, reflecting rapid flow in the middle of the vessel and slower flow near its walls.
-Disturbed flow, such as turbulence, is indicated by a wide range of colors in a scrambled pattern |
|
|
What four things cause color to change on color Doppler imaging?
|
Changes in color within a blood vessel on a color flow US image may be caused by:
(1) change in the Doppler angle (2) change in blood flow velocity (3) aliasing (4) artifact |
|
|
What causes aliasing?
|
Aliasing happens with high-velocity blood flow and improper velocity scale and baseline settings.
|
|
|
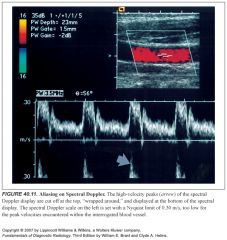
What does aliasing look like on spectral and color Doppler?
|
-Aliasing on spectral displays is seen as a “wraparound” of peak velocities to the opposite end of the scale
-The highest velocities are cut off one side of the scale and artifactually displayed on the opposite side of the scale. -Aliasing on color Doppler “wraps around” high velocities onto the opposite color scale -For example, velocities too high for the red-scale setting are artifactually displayed as shades of blue. |
|
|
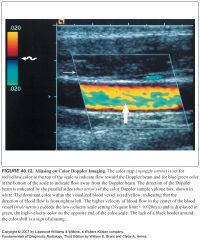
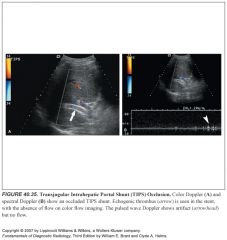
How can you tell true color changes apart from aliasing?
|
True color changes are always surrounded by a black border, whereas color shifts related to aliasing lack this black border.
|
|
|
What is the Nyquist limit?
|
The maximum frequency that can be accurately detected without aliasing is called the Nyquist limit and is equal to half the PRF.
|
|
|
Define pulse repetition frequency:
What should the optimal PRF be set at to avoid aliasing? |
-The rate at which pulses can be transmitted (the pulse repetition frequency [PRF]) is limited by the depth of the vessel interrogated.
-Deeper vessels require more time for the US beam to travel to the vessel and for the echo to return. -To avoid aliasing, the PRF must be at least twice the frequency of the signal to be detected. |
|
|
What is color flash? What makes color flash worse?
|
-Rapid movement of the transducer itself may produce a Doppler shift and a flash of color projected over the grayscale image.
-Most instruments incorporate motion discriminators that suppress color flash in hyperechoic but not in hypoechoic areas. -Color flash is accentuated in cysts, the gallbladder, and other hypoechoic nonvascular structures. |
|
|
What is a tissue vibration artifact?
|
Tissue vibration may produce color display in perivascular tissues, indicating flow where none is present. Tissue vibration artifact is produced in non-flow areas by bruits, arteriovenous fistulas, and shunts.
|
|
|
What was the big conclusion of the NASCET and ECST trials?
|
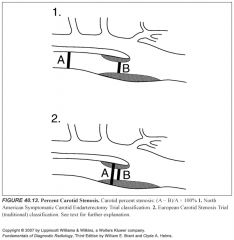
-In 1991, two randomized prospective multicenter studies, the North American Symptomatic Carotid Endarterectomy Trial (NASCET) and the European Carotid Stenosis Trial (ECST) demonstrated a clear benefit of carotid endarterectomy in patients with an internal carotid artery (ICA) stenosis ≥70% of the diameter, as defined by conventional angiography.
-Most investigators regard the NASCET study as the gold standard that makes carotid endarterectomy the standard of care for symptomatic carotid stenosis ≥70% and, in selected cases, ≥50%. -No patients benefit with a stenosis <50%. -Additional data from NASCET published in 1998 showed modest benefits of endarterectomy for stenoses measuring 50% to 69% as long as the rate of the institution's serious surgical complication rate was <2% |
|
|
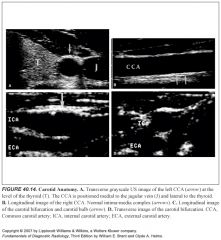
What are the three layers of the common carotid artery? What do they look like on ultrasound? What is the normal thickness of the common carotid artery?
|
-US evaluation of the CCA often demonstrates the three layers of the normal vessel wall: the echogenic intima, hypoechoic media, and echogenic adventitia (think: a sandwich of dark stuff between two pieces of white bread)
-The distance between these two echogenic lines (intima-media complex) is normally less than 1.1 mm. |
|
|
At which levels are the vertebral arteries contained within the transverse foramina?
|
They ascend in the transverse foramen of C2 to C6
|
|
|
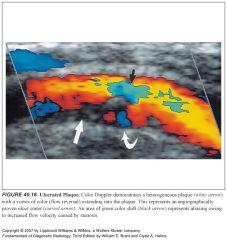
What does ulcerated plaque look like on ultrasound?
|
-US is unreliable in the diagnosis of plaque ulceration.
-Grayscale US findings suggestive of ulceration include undercutting of the plaque margin, a sonolucent area that extends to the surface of the plaque, and a divot or crater on the surface of the plaque. -Color Doppler may demonstrate flow into the crater with flow reversal. |
|
|
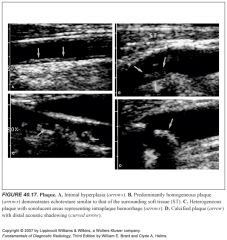
How are atherosclerotic plaques described? How does their appearance relate to their content?
|
-Hypoechoic, isoechoic, and hyperechoic are the terms used to describe plaque density.
-The more hypoechoic (or anechoic) the plaque, the higher its lipid content. -Isoechoic plaques contain more smooth muscle, and hyperechoic plaques contain a large amount of fibrous tissue. -Color Doppler is useful to help identify areas of anechoic plaque not seen in the vessel lumen because they are isoechoic with blood. -Plaque texture is either homogeneous or heterogeneous. Because of its high content of fibrous tissue, homogeneous plaque is smooth and similar in echotexture to the surrounding soft tissues. -Heterogeneous plaque is complex, with at least one focal area of sonolucency representing intraplaque hemorrhage. -All ulcerated plaques are heterogeneous, but not all heterogeneous plaques ulcerate. -Plaque calcification is a nonspecific finding and is seen in both homogeneous and heterogeneous plaque. |
|
|
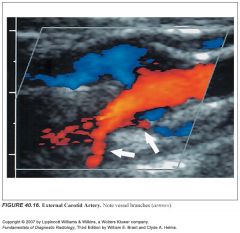
How can you tell the difference between the ICA and ECA on ultrasound?
|
-ICA should be low resistance, and ECA should be high resistance.
-If it's difficult to tell, the sonographer palpates the pulse and then digitally taps either the superficial temporal or preauricular branch of the ECA. -The tapping is transmitted back to the ECA as the “sawtooth” pattern on the spectral display. |
|
|
Is the vertebral artery a high or low resistance vessel?
|
Low resistance
|
|
|
What is the clinical significance of an atherosclerotic plaque's morphology on ultrasound?
|
-No study to date demonstrates a definite stroke reduction from endarterectomy or medical management based on the US characteristics of plaque.
-Until conclusive evidence exists that plaque morphology can predict stroke, spectral Doppler (velocity parameters) and diameter stenosis (residual vessel lumen) remain the most important factors in carotid duplex interpretation. |
|
|
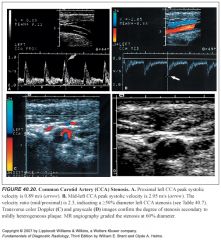
How is peak systolic velocity used to measure ICA stenoses?
|
-PSV is the most accurate parameter for a stenosis greater than 50% and less than 90%.
-The ICA/CCA ratio is most helpful when the CCA velocities are abnormal -At approximately 50% stenosis, spectral broadening of the ICA waveform and a mild increase in PSV are noted. -Above 90% to 95% stenosis, the PSV falls as stenosis approaches occlusion. |
|
|
What sorts of things would cause low (< 50cm/s) CCA PSV's bilaterally?
|
-Low cardiac output
-Congestive heart failure -Cardiomyopathy -Pericardial effusion -Wide diameter arteries |
|
|
What sorts of things would cause high (>100cm/s) CCA PSV's bilaterally?
|
-High cardiac output
-Hypertension -Hyperthyroidism -Bradycardia -Narrow diameter arteries |
|
|
What sorts of things would cause low (< 50cm/s) CCA PSV on one side only?
|
-Sevre proximal stenosis
-Severe distal stenosis or occlusion -Wide diameter CCA -Long segment stenosis |
|
|
What sorts of things would cause high (>100 cm/s) CCA PSV on one side only?
|
-Technical problems (e.g., tortuous vessel)
-CCA stenosis -Narrow diameter CCA -Contralateral severe stenosis |
|
|
What ICA PSV correlates with >70% stenosis (but does not indicate near occlusion)?
|
>230 cm/s
think: "too dirty"--too much plaque |
|
|
What ICA/CCA PSV ratio indicates a >70% stenosis (but does not indicate near occlusion)?
|
>4
|
|
|
What ICA/CCA PSV ratio indicates a >50% stenosis?
|
2-4
|
|
|
What ICA PSV correlates with >50% stenosis (but less than 70%)?
|
125-230 cm/sec
|
|
|
What is the peak systolic velocity ratio?
What PSV ratio corresponds to a 50% stenosis? a 70% stenosis? a 90% stenosis? |
-The velocity at the stenosis is divided by the velocity proximal to the stenosis
-2:1 -3.5:1 -7:1 |
|
|
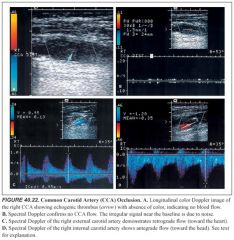
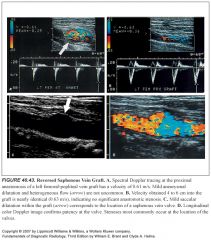
What does CCA occlusion look like on ultrasound? How does the ICA fill if the CCA is occluded?
|
-CCA occlusion is easily identified on duplex scanning. No spectral waveform or color flow can be elicited.
-Echogenic clot can often be seen filling the CCA lumen. -Antegrade flow is usually present in the ipsilateral ICA, secondary to retrograde flow through the ECA to the carotid bifurcation and into the ICA. -Spectral analysis in this situation demonstrates reversed flow in the ECA |
|
|
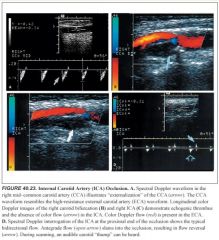
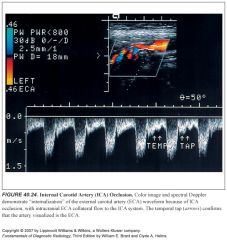
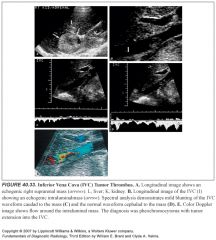
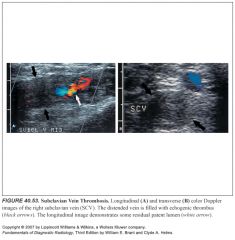
What does ICA occlusion look like on ultrasound? How does the presence of ECA-ICA collaterals affect this appearance?
|
-ICA occlusion is suggested when no flow is identified in the vessel with spectral analysis and color flow imaging.
-On grayscale, the ICA diameter may be small and filled with echogenic thrombus. -A brief systolic pulse (followed by a flow reversal) is usually present at the proximal end of the obstruction owing to the “thumping” of blood against the occlusion. -The CCA waveform has a high-resistance flow pattern, with decreased diastolic flow velocity more characteristic of the ECA. -This pattern is often called “externalization of the CCA”. -If the patient has well-developed ipsilateral ECA-to-ICA collateral flow intracranially, the CCA may not be externalized. In this circumstance, the ECA waveform becomes more low resistance or ICA-like, often called “internalization of the ECA” because it then supplies brain parenchyma |
|
|
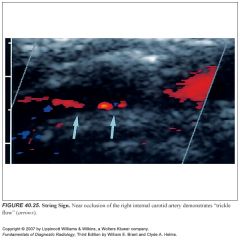
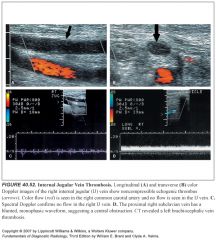
How can you tell the difference between total occlusion of the ICA and trickle flow?
|
-The distinction between total occlusion of the ICA and trickle flow is of critical importance.
-Patients with trickle flow are candidates for carotid endarterectomy, and those with total occlusions are not. -Despite advances in duplex US, 5% to 7% of trickle flow is not detected on grayscale, spectral Doppler, or color Doppler imaging. -Power Doppler may improve the detection rate. -MRA has an accuracy similar to that of duplex US. -Therefore, catheter angiography is still recommended to exclude a “string sign” when the Doppler suggests occlusion. -CTA is performed in lieu of catheter angiography in some settings. |
|
|
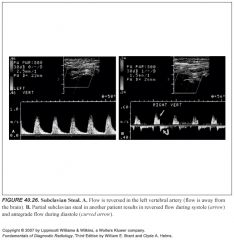
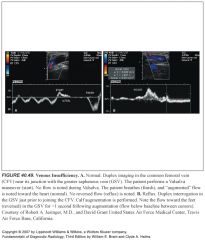
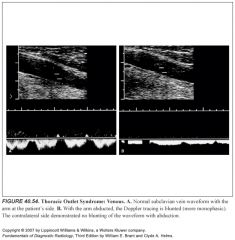
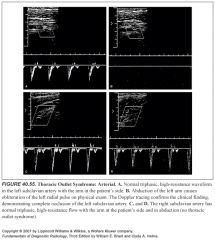
Describe subclavian steal syndrome:
What would partial subclavian steal represent? |
-Innominate or subclavian artery occlusion proximal to the origin of the vertebral artery results in the subclavian steal syndrome.
-In this circumstance, the upper extremities receive blood from the CCA through the circle of Willis and down the vertebral artery. -Spectral Doppler demonstrates reversed flow in the vertebral artery. -Partial subclavian steal results in reversed flow during systole and antegrade flow during diastole in the vertebral artery because of severe stenosis of the innominate or left subclavian artery |
|
|
What is the correct angle of velocity measurement?
|
The technician must ensure that the angle of insonation is between 30° and 60°. Spectral analysis with angles of interrogation >60° may cause large errors in velocity calculation
|
|
|
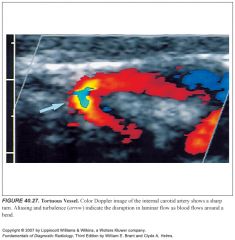
How can a tortuous vessel cause problems when measuring flow velocities?
|
The laminar flow pattern is disrupted as blood flows through a sharp bend. Reporting of the higher velocity at the outer bend in a tortuous vessel may overestimate the degree of stenosis or falsely suggest a stenosis when none is present
|
|
|
What does flow through the carotid bulb look like normally?
|
Normal flow reversal is usually noted in the carotid bulb opposite the flow divider and should not be mistaken for pathologic flow.
|
|
|
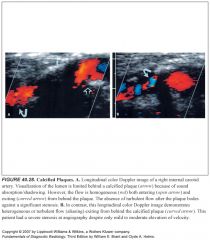
How do you estimate vessel stenosis in the presence of densely calcified plaque?
|
-Dense calcification can make it impossible to obtain velocities in portions of the ICA because of acoustic shadowing.
-As a result, a significant stenosis may not be detected. -Color flow imaging is helpful in this situation. -If the color flow into and out from behind the plaque is homogeneous, the presence of a significant stenosis is unlikely. -However, if flow proximal to the plaque is homogeneous and flow distal to the plaque is heterogeneous, a significant stenosis should be suspected |
|
|
How does high grade ICA stenosis or occlusion affect the contralateral side?
|
With unilateral ICA occlusion or high-grade stenosis, flow velocity in the contralateral CCA and ICA may be elevated to maintain cerebral perfusion pressure.
|
|
|
How would segmental stenoses of the ICA affect interpretation?
|
-The presence of more than one high-grade stenotic lesion can lead to interpretation errors.
-A significant intracranial ICA lesion causes a reduction in PSV, with absence of diastolic flow in the cervical portion of the ICA. -Alternatively, a significant proximal CCA lesion lowers the PSV and increases the diastolic flow. -In either circumstance, a stenosis in the cervical ICA may be underestimated. |
|
|
How in the world could somebody mistake the ECA for the ICA?
|
-Remember that the ECA waveform may be internalized in the setting of ICA occlusion because of collateral flow.
-Use the temporal tap and look for branch vessels to identify the ECA |
|
|
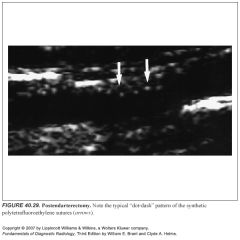
What does the ICA look like on ultrasound after endarterectomy?
|
-Following endarterectomy, the vein or polytetrafluoroethylene (PFTE) patch sutures may remain visible along the arterial wall.
-A patulous carotid artery at the operative site is common. -The postendarterectomy waveform often has a high-resistance flow pattern like that of the ECA. -Turbulent flow is often noted because of the absence of the smooth endothelial lining. |
|
|
What kind of complications are seen after carotid endarterectomy?
|
Complications include restenosis (~10% to 15% within the first year because of intimal hyperplasia), intimal flaps, and clamp strictures.
|
|
|
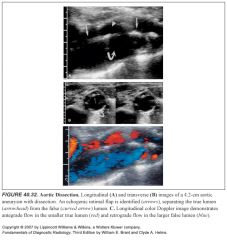
Think of some nonatherosclerotic diseases that affect the carotid arteries:
|
-Remember that not all carotid disease is atherosclerotic. Takayasu arteritis and radiation fibrosis cause diffuse concentric wall thickening and narrowing of the lumen.
-Fibromuscular dysplasia in the cervical CCA produces irregular intimal thickening over the full length of the artery. -Carotid dissection can be traumatic, inflammatory, degenerative, or spontaneous. -Systolic flow reversal and intimal flaps can be seen. -Carotid body tumors or vascular invasion from metastases can be visualized with duplex scanning. |
|
|
What kind of waveform is produced by aortic stenosis?
|
Significant aortic stenosis produces a bilateral parvus-tardus waveform
|
|
|
What kind of waveform is produced by aortic insufficiency?
|
Aortic insufficiency demonstrates a bisferious pulse, with the second systolic peak higher than the first.
|
|
|
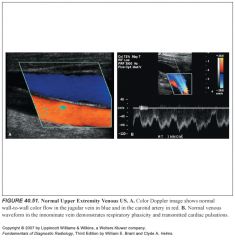
What type of waveform does the aorta have?
What about the IVC? |
Spectral analysis demonstrates a triphasic waveform.
-Spectral analysis of the IVC demonstrates the classic “sawtooth” pattern from cardiac and respiratory pulsations similar to the hepatic veins. -Distally near the common iliac veins, there is a more phasic pattern similar to that seen in the proximal extremities. |
|
|
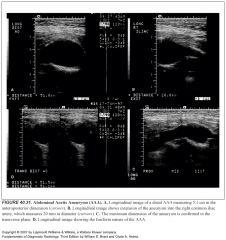
When do abdominal aortic aneurysms get operated on?
|
Surgery is recommended for aneurysms >5 cm.
|