![]()
![]()
![]()
Use LEFT and RIGHT arrow keys to navigate between flashcards;
Use UP and DOWN arrow keys to flip the card;
H to show hint;
A reads text to speech;
26 Cards in this Set
- Front
- Back
|
In _________ Statistics, Sample must be unbiased, representative of the population, and large enough. |
Inferential |
|
|
The ‘Gold Standard’ to which other sampling techniques aspire |
Random Sampling |
|
|
every member of the population must have an equal chance of being selected |
Equi-probability |
|
|
the selection of any one member of the population should not affect the chances of any other being selected. |
Independence |
|
|
Random Sampling is virtually impossible |
Volunteer sample Snowball sampling Purposive sampling Convenience sampling |
|
|
Simple Random Sampling Stratified Random Sampling Multistage Sampling Digital Number Sampling |
Random Sampling |
|
|
Formula to calculate the area under the normal distribution |
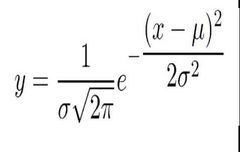
● Y = frequency of a given value of X* ● X = any score in the distribution ● µ = mean of the distribution ● N = total frequency of the distribution ● π = a constant of 3.1416 ● e = a constant of 2.7183 |
|
|
In Normal Distribution, if ___________ and ___________ is given, then everything that is needed to know is given. |
Mean and Standard Deviation |
|
|
_______of cases lie within 2 SDs of the Mean. ________of cases lie between the Mean and -2 SDs. ________ of cases lie between the Mean and +3 SDs. ________ of cases lie more than 2 SDs below the Mean |
95.45% 47.72% 49.9% 2.27% |
|
|
Z-score formula |
Z = (x-μ)/σ |
|
|
A score that is presented in terms of the number of standard deviations above the mean is called a __________ |
z-score |
|
|
a transformed score that designates how many Standard Deviation units the corresponding raw score is above or below the Mean |
Z-SCORE |
|
|
process by which the raw score is altered |
Score transformation |
|
|
_________ allows us to determine the number or percentages of scores that fall above or below any score in the distribution. |
Z-score |
|
|
What is the Important use of Z-score |
The ability to compare scores that are measured on different scales is of fundamental importance to the topic of correlation. |
|
|
Z- scores have the same shape as the set of _____________. |
Raw scores |
|
|
In normal distribution the mean of the z-score, will always be equal to ______ (meaning it will have the same mean as the raw scores) |
Zero |
|
|
A raw score that is 1 SD above the mean has a z score of |
+1 |
|
|
Tells us that, given some assumptions, the sampling distribution of the mean will form a normal distribution, with a large sample. With a smaller sample, the distribution will be t-shaped. |
Central Limit Theorem |
|
|
The CLT tells us that if the distribution in the sample is approximately normal, then the ________ distribution will be the correct shape |
sampling |
|
|
If the sample distribution is not normal, but the sample is large enough, then the sampling distribution will still be normal (or__________). |
T-shaped |
|
|
The central limit theorem states |
that the sampling distribution of any statistic will be normal or nearly normal, if the sample size is large enough |
|
|
The more closely the sampling distribution needs to resemble a normal distribution, the more sample points will be required |
Requirements for accuracy |
|
|
The more closely the original population resembles a normal distribution, the fewer sample points will be required. |
The shape of the underlying population |
|
|
standard deviation of the sampling distribution of the mean. |
Standard Error |
|
|
In a histogram represented as a line chart, with continuous variables on the x-axis (and where the y-axis represents the _______________) |
frequency density (mostly quantity ng variables) |