Reading...
![]()
Play button
![]()
Play button
![]()
Use LEFT and RIGHT arrow keys to navigate between flashcards;
Use UP and DOWN arrow keys to flip the card;
H to show hint;
A reads text to speech;
9 Cards in this Set
- Front
- Back
|
assignable variation
|
caused by factors that can be clearly identified and possibly managed
(i.e. a poorly trained employee that creates variation in finished product output) |
|
|
common variation
|
variation that is inherent in the production process
(1.e. a molding process that always leaves "burrs" or flaws on a molded item) |
|
|
Taguchi's View of Variation
|
traditional view is that quality within the range is good and that the cost of quality outside this range is constant
views costs as increasing as variability increases, so seek to achieve zero defects and that will truly minimize quality costs |
|
|
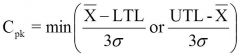
Capability Index
|
shows how well parts being produced fit into limit specifications
|
|
|
attribute measurement
|
measurement by attributes means taking samples and using a single decision - the item is good/bad
P-chart application |
|
|
variable measurement
|
usually measures the actually weight, volume, number of inches or other "variable" measurements.
--generally want small sample size (4-5) --quicker and cheaper --want 25 or so samples to set up chart X-bar and R-chart applications |
|
|
Capability Index Formula
|
|
|
|
process control using P-charts
|
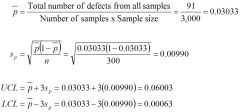
Attribute measurement, each item is either good/bad
|
|
|
process control using C-charts
|
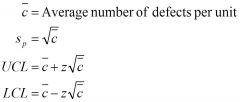
attribute measurement, product can have multiple defects
|