![]()
![]()
![]()
Use LEFT and RIGHT arrow keys to navigate between flashcards;
Use UP and DOWN arrow keys to flip the card;
H to show hint;
A reads text to speech;
33 Cards in this Set
- Front
- Back
- 3rd side (hint)
|
Vertical Common-Size Income Statement Ratios |
Vertical Common-Size Income Statement Ratios = Income Statement Account÷Sales |
You divide the income statement item by the same number as you do to get: Gross Profit Margin, net profit margin etc. |
|
|
Vertical Common-Size Balance Sheet Ratios |
Vertical Common-Size Balance Sheet Ratios = Balance Sheet Account ÷ Total Assets |
|
|
|
[Define] Activity Ratios |
Measures efficiency of day-to-day tasks/ operations.
|
|
|
|
[Define] Liquidity Ratios |
Measures ability to pay short-term liabilities.
|
|
|
|
[Define] Solvency Ratios |
Measures ability to pay long-term liabilities.
|
|
|
|
[Define] Profitability Ratios |
Provide information on how well the company generates operating profits and net profits from its sales/ asset base.
|
|
|
|
[Define] Valuation Ratios |
Quantity of assets of flow of assets associated with an ownership claim. Examples: Sales per share, earning per share etc. |
|
|
|
Activity Ratios
|
|
|
|
|
Activity Ratios
|
|
|
|
|
Activity Ratios
|
Note: Purchases = ending inventory - beginning inventory + COGS |
|
|
|
Activity Ratios |
Working capital turnover = Revenue ÷ Avg. working capital
|
Measures how effectively a company is using its working capital (A measure of asset utilization) |
|
|
Activity Ratios
|
|
|
|
|
Liquidity Ratios
|
|
1. If the Current ration > 1, paying of liabilities with current assets will increase the current ratio. |
|
|
Liquidity Ratios Defensive Interval Ratio |
Defensive Interval Ratio = (Cash+receivables+short-term marketable securities) ÷ Daily cash expenditure **Measures the number of days of avg. cash expenditure the firm could pay with its current liquid assets. |
|
|
|
Liquidity Ratios Cash Conversion Cycle |
Cash conversion cycle= (Days of sales outstanding) + (days of inventory on hand) - (number of days of payables) **The length of time it takes to turn the firm's cash investment in inventory back into cash. |
|
|
|
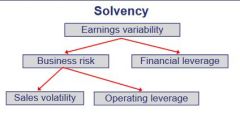
Solvency (graphical representation) |
|
|
|
|
Solvency Ratios
|
**Total debt = Long-term debt+interest bearing short-term debt *Capital= All short-term and long-term debt plus preferred stock & equity |
|
|
|
Solvency Ratios
|
*Uses avg. (even though it's a pure BS ration b/c it's part of the DuPont analysis) **Total debt = Long-term debt+interest bearing short-term debt |
The higher the leverage ratio is the more levered a company is (i.e. the higher the assets are in relation to its equity, the more leverage in its capital structure) |
|
|
Solvency Ratios
|
**EBIT= Earning before interest and tax (proxy for operating income) |
|
|
|
Profitability Ratios
|
*Operating Income = EBIT (proxy). Gross profit = net sales- COGS Net Income= earning after tax but before dividend |
|
|
|
Profitability Ratios
|
*EBT=Earning before tax but after interest |
|
|
|
Profitability Ratios
**Regular and modified |
** use the regular ROA equation if not specified otherwise |
|
|
|
Profitability Ratios
|
|
|
|
|
DuPont System: Original Equation (3-stage) |

Breaks ROE down to Net Profit Margin, Asset turnover & Leverage ratio. If ROE is low at least one of the following is true, the company: 1. has poor profit margin 2. has poor asset turnover 3. too little leverage |
|
|
|
DuPont System: Extended Equation (5-stage) |
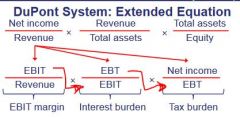
Breaks down ROE further by breaking down net profit margin to (1-3). ROE becomes: (1) EBIT Margin, (2) Interest Burden, (3) Tax burden, (4) Asset turnover, (5) Leverage. |
|
|
|
Valuation Ratios (per share)
|
|
2. P/CF - a low ratio indicates an undervalued stock (i.e. a blue stock) 4. P/BV - a higher ratio indicates higher growth (i.e. a growth stock) |
|
|
Per-share quantities
|
|
|
|
|
Per-share quantities
|
|
|
|
|
Dividend related quantities
|
|
1. A high dividend payout ratio indicates a more mature, slow growing company. |
|
|
Business Risk Ratios
|
|
|
|
|
Segments Ratios
|
**EBIT = proxy for profit above |
|
|
|
LONG LIVED ASSETS
|
*PP&E net of acc. depr. |
|
|
|
More long lived asset:
|
|
|