Reading...
![]()
Play button
![]()
Play button
![]()
Use LEFT and RIGHT arrow keys to navigate between flashcards;
Use UP and DOWN arrow keys to flip the card;
H to show hint;
A reads text to speech;
105 Cards in this Set
- Front
- Back
|
Cost that includes both variable costs and fixed costs.
|
Mixed Cost
|
|
|
Minor products of small value that resulted from the manufacture of the main product
|
By–products
|
|
|
Outputs with significant value that cannot be distinguished for each product in the manufacturing process, so common costs must be allocated by some arbitrary means.
|
Joint products
|
|
|
FIFO Equivalent Units
|
Beginning WIP X % to be completed (1–%complete)
+units completed –units in beginning +WIP ending X % completed *Only use ending % complete |
|
|
Weighted Avg Equivalent Units
|
Beginning inventory X % completed
+FIFO equivalent units *Use beginning and ending inventory cost or Completed units +ending inventory X % completed |
|
|
Joint Cost using quantity
|
[Joint Cost
Less NRV of byproduct (end selling price X total qty)] X (quantity of product @ split off/ total of quantity at split off) |
|
|
Prime Cost for DM
|
Beginning DM+purchase+transportation–returns/allowance=materials available
Less end DM =materials used |
|
|
Cost of goods transferred to finished goods (manufactured) COGM
|
WIP beginning+DM (used)+DL+OH applied
=manufacturing incurred less WIP end |
|
|
Calculate COGS
|
Finished goods beginning
+COGM =COG available for sale Less finished goods end |
|
|
Product costing for a sequentially moving manufacturing process. Used when few units are produced and each unit is unique.
|
Job Order Costing
|
|
|
Product costing that averages costs for large homogeneous items.
|
Process Costing
|
|
|
Manufacturing Cost Calculation
|
DM (used) + DL + OH applied
|
|
|
Calculate overhead under/over applied
|
1.Total standard costs / total standard hours = application rate per hour
2. Total actual hours * application rate = budgeted amount 3. Actual – budgeted amount = over/under applied OH |
|
|
Increase in the level of risk results in an increase in management's required rate of return. Higher expected returns to compensation for greater risk.
|
Risk–Averse Behavior
|
|
|
Increase in the level of risk does not result in an increase in management's required rate of return. Seek highest return
|
Risk–Indifferent Behavior
|
|
|
Increase in the level of risk results in a decrease in Management's required rate of return. Willing to settle for lower expected returns as the level of risk increases.
|
Risk–Seeking Behavior
|
|
|
Represents the portion of a single asset's risk that is associated with random causes and can be eliminated through diversification.
|
Diversifiable Risk (nonmarket, unsystematic, or firm specific risk)
|
|
|
Risk that affect all firms and cannot be eliminated through diversification. Ex: war, inflation, High IR, international incidents, and political evens, recessions.
|
Nondiversifiable Risk (market or systematic risk)
|
|
|
Foreign Currency chart of affects
|
Foreign $ Domestic $ Net inflow net outflowDepreciation Appreciation Loss GainAppreciation Depreciation Gain Loss
|
|
|
Cooperation amongst nations to address global issues
|
Functional Interdependence
|
|
|
Global issues, sharing earth. Actions of governments that adversely impact the climate or reduce safety impact all nations.
|
Systemic Interdependence
|
|
|
Requires an acknowledgement of the interdependence of nations and cooperation among nations consistent with shifts in the balance of power.
|
Multipolarity
|
|
|
Examples: U.S. sole economic & military superpower.
|
Unipolar
|
|
|
List prevention Costs
|
1. Training
2. Inspection 3. Preventive maintenance 4. Redesign process/product 5. Search for vendors |
|
|
List Appraisal Costs
|
1. Testing
2. Inspection 3. Maintenance 4. Statistical quality checks |
|
|
List Internal Failure Costs
|
1. Rework
|
|
|
List External Failure Costs
|
1. Warranty costs
2. Cost of returning the good 3. Liability claims – complaints 4. Lost customers –complaints 5. Re–engineering an external failure |
|
|
Define Vertical Linkage Analysis (Value Chain Analysis)
|
Understanding the activities of the suppliers and buyers of the product
|
|
|
Define Internal differentiation Analysis (Value Chain Analysis)
|
Create value through differentiation, benefits are greater than cost.
|
|
|
Perfect (pure) competition attributes
1. control over price and quantity 2. Elasticity 3. Profitability 4. Strategy |
1. Only controls quantity, price set by market
2. Perfectly elastic 3. no profit 4. maintain market share, responsive to market price |
|
|
Monopolistic Competition attributes
1. control over price and quantity 2. Elasticity 3. Profitability 4. Strategy |
1. Controls quantity, primarily relies on market price
2. Highly elastic, adjust quantity w/o effecting price 3. no profit 4. Maintain market share, product diff, allocation of resources |
|
|
Oligopoly attributes
1. control over price and quantity 2. Elasticity 3. Profitability 4. Strategy |
1. Control over price and quantity
2. inelastic, kinked demand curve 3. Positive 4. Maintain or enhance market share, proper spending, adapt to price changes and product volume |
|
|
Monopoly
1. control over price and quantity 2. Elasticity 3. Profitability 4. Strategy |
1. Control over price and quantity
2. Inelastic 3. Positive 4. Ignore market share and focus on profitability from production levels that max profits |
|
|
Supply Chain Operations Reference model process
|
Plan, Source, make, deliver
|
|
|
Workers routinely change jobs or from worker's being temporarily laid off.
|
Frictional Unemployment
|
|
|
Jobs available do not correspond to skills in the workforce or do not live in area where jobs are located. Possible changes in technology is a cause
|
Structural Unemployment
|
|
|
Seasonal changes n the supply and demand of labor.
|
Seasonal Unemployment
|
|
|
Amount of unemployment resulting from declines in real GDP during periods of a recession (contraction).
|
Cyclical Unemployment
|
|
|
Government Purchases of goods and services
Gross private domestic investment (fixed investments & change in inventories Personal consumption expenditures Net exports(exports minus imports) |
Expenditure Approach
|
|
|
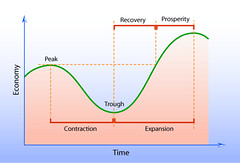
Describe Business cycles
1. Expansionary Phase 2. Peak 3. Contractionary Phase 4. Trough 5. Recovery |
|
|
|
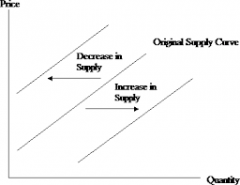
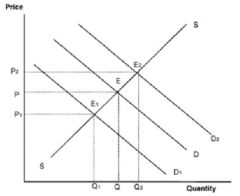
What happens with an increase in demand?
increase in supply? |
|
|
|
What happens with an decrease in demand?
decrease in supply? |
|
|
|
Calculate the Multiplier effect
|
1 1
------------ or ----------- (1–MPC) 1 / MPS |
|
|
Sequence of Events in an AIS (Accounting information System)
|
1. Input sourch documents
2. file source documents 3. Record in journal and posted to GL and sub ledger 4. Trial balances are prepared w/ adj and accruals 5. Financials are generated. |
|
|
Calculate WACC (weighted avg cost of capital)
|
Cost of equity X % of equity
Add: weighted avg cost of debt X % of debt (% of debt = cost of debt x (1–Tax %)) *Lower WACC is better |
|
|
Calculate a payment discount
|
360 discount
------------------------------------- X ------------------------- pay period–discount per 100%–discount % |
|
|
Calculate CAPM (Capital Asset Pricing Model)
|
Risk free rate (krf) + risk premium (PMR)
or krf + (bi x (km–krf)) |
|
|
Calculate degree of financial leverage
|
% Change in EPS
--------------------------- % Change in EBIT |
|
|
Calculate Return on investment
|
Income --------------------------- or avg PP&E + avg Wcinvestment Capital
or Profit margin * Investment turnover Profit margin = income / sales Investment turnover = sales / avg investment |
|
|
Calculate Residual Income
|
Net income – required return
Required return = net book value * hurdle rate |
|
|
Calculate Times Interest earned
|
EBIT/ Total interest Expense
EBIT = Pretax income/ (1–T%) + interest |
|
|
Calculate Net Present Value (NPV)
|
1. After–tax Cash flows: Annual net $ inflow x (1–T%)
2. Add Depreciation benefit 3. X present value of annuity 4. – initial cash outflow |
|
|
Payback Period
|
Net initial investment / increase in annual net after–tax cash flow
*time value of money is ignored |
|
|
Net initial outflow
|
Invoice + shipping+installation
+ increase in working capital –proceeds on sale of old equipment |
|
|
Explain how tax is used in the following NPV calculations: 1. annual depreciation shield
2. Annual savings 3. Salvage Value inflow 4. working capital |
1. Depreciation X Tax %
2. Savings per year X (1–tax%) 3. (salvage value – basis (includes depreciation if not fully depreciated)) x (1–tax%) 4. don't use. |
|
|
Calculate Profitability Index
|
PV of net future cash inflows / present value of net initial investment
or PV FCF – cost today *Greater than 1 means +NPV |
|
|
Balanced Scorecard critical factors(FICA)
|
1. financial
2. internal business processes 3. customer satisfaction 4. advancement of innovation and HR development |
|
|
Strategic Business Unit's 4 financial measures (performance objectives) for managers from lowest to highest (CRPI)
|
1. cost
2. revenue 3. profit 4. investment (return on assets) – independent |
|
|
Flexible budget allow you to adjust which factors?
|
1. production
2. sales |
|
|
The order budgets must be prepared
|
1. Sales
2. Production & SG&A 3. DM , DL, OH 4. COGS 5. Cash (all budgets needed for this) |
|
|
Calculated Efficiency Variance (DL)
|
Step 1: Actual hours X standard rate only
Step 2: Actual units X standard hours x standard rate Step 3: Step 1 – Step 2 = variance (+ unfavorable, –favorable) |
|
|
Costs that are unavoidable because they have already occurred and cannot be recovered. Not a relevant cost.
|
Sunk Costs
|
|
|
The additional costs incurred to produce an additional amount of the unit over the present output.
|
Incremental Costs
|
|
|
Costs that can be authorized at a specific level of management.
|
Controllable Costs
|
|
|
Costs that were authorized at a different level. Not a relevant cost because they cannot be changed.
|
Uncontrollable Costs
|
|
|
Cost for a one–unit increase in activity. These include all variable costs and any avoidable fixed costs associated with decision.
|
Marginal Costs
|
|
|
Cushion, the excess of sales over break even sales. Expressed in $$$ or as a %.
|
Margin of Safety
|
|
|
Calculate Breakeven Sales
|
Fixed costs / (CM / Sales)
|
|
|
Calculate Margin of Safety
& Margin of Safey % |
1. Total sales – Breakeven sales
2. Margin of Safety in $ / Total sales |
|
|
Contribution Margin
Contribution Margin % (ratio) |
1. Break even sales X CM ratio
2. CM/ Total Sales |
|
|
Calculate Stockholder's Equity
|
Total Assets – Liabilities
|
|
|
Calculate Current Ratio
|
Current Assets / Current Liabilities
|
|
|
Calculate Return on Stockholder's Equity
|
Net Income / Stockholder's Equity
|
|
|
Calculate Breakeven point in $$$
|
Total fixed costs / CM ratio
|
|
|
Regression Analysis
|
A method for studying the relationship between 2 or more variables. Predicts the value of dependent variable corresponding to given values of the independent variables (ie fixed cost, variable cost/unit). More accurate than high–low method
|
|
|
Technique used to estimate the fixed and variable portions of cost, usually production costs. Used for flexible/performance budgets
|
High–Low Method
|
|
|
Step–by–step method of projecting costs when learning is a variable, often for repititve task. The rate is a percentage of the decrease in avg time (or total) as production doubles.
|
Learning Curve
|
|
|
Product costing for a sequentially moving manufacturing process. Used when few units are produced and each unit is unique.
|
Job Order Costing
|
|
|
Product costing that averages costs for large homogeneous items.
|
Process Costing
|
|
|
5 Components of COSO (CRIME)
|
1. Control environment
2. Risk Asessment 3. Info. & Comm systems 4. Monitoring 5. Existing Control activities |
|
|
Risk Response (is eaR aim)
|
1. Avoidance
2. Reduction 3. Sharing 4. Acceptance |
|
|
Inherent Risk
|
Risk if management takes NO action
|
|
|
Residual Risk
|
Risk AFTER management takes action to mitigate adverse impacts of an event
|
|
|
Fraud Risk
|
1. Incentive/pressure
2. Rationalization 3. Opportunity |
|
|
Internal Environment
|
1. Risk Appetite
2. Organizational structure 3. Ethics 4. BoD 5. Authority and Responsibility |
|
|
Avoidance (risk response)
|
Avoids or terminates risk (disc ops)
|
|
|
Reduction (risk response)
|
Elect to reduce or mitigate risk (invest in inventory technology or closely monitor inventory)
|
|
|
Sharing (risk response)
|
Reduce risk by transferring (insurance)
|
|
|
Acceptance (risk response)
|
No action in risk response
|
|
|
Monitoring (criMe)
|
1. Ongoing monitoring – controls
2. Separate evaluations – fresh look at controls 3. Reporting deficiencies |
|
|
Code of ethics (internal environment)
|
1. Honest & ethical conduct
2. Full, fair, accurate, and timely disclosures in f/s 3. Compliance with laws, rules & regulations |
|
|
Event Identification Techniques
|
1. Event Inventories – List of potential events common to industry
2. Internal analysis – Analysis performed by staff 3. Escalation or threshold triggers – comparison of predefined criteria may identify events (var from std) |
|
|
Objectives (ERM)
|
1. Strategic – goals, mission, increase s/h value
2. Operations – effectiveness, efficiency & profitability 3. Reporting – reliable 4. Compliance – laws, rules, and regulations |
|
|
The Business Judgement Rule (Fiduciary Duty)
|
Directors must always act in the best interest of the Corporation
|
|
|
Marketing for a single sale – lowest price (used car)
|
Transaction Marketing
|
|
|
Marketing for an ongoing relationship – loyalty
|
Interaction – Based Relationship marketing
|
|
|
Marketing for target markets
|
Database marketing
|
|
|
Marketing with the use of internet
|
E–marketing
|
|
|
Multilevel marketing with focus on relationships and referrals
|
Network marketing
|
|
|
Total Factor Productivity Ratios
|
Output / Total Cost
Material & Labor costs (all inputs) |
|
|
Partial Productivity Ratios
|
Output / Specific Quantity
Material & Labor for specific quantity |
|
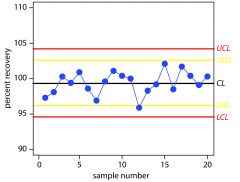
Control Charts
|
Plot comparison of actual results by batch to an acceptable (std) range.
Show trends toward improved quality conformance or deteriorating quality conformance (zero defects). |
|
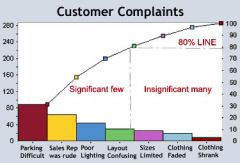
Pareto Diagrams (Histogram)
|
Shows the frequency of quality issues (defects).
Determines the quality–control issues that are most frequent and often demand the greatest attention. |
|
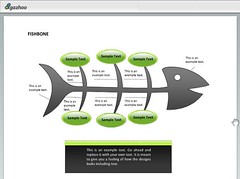
Cause–and–Effect Diagram (fishbone)
|
Used to identify the sources of problems in process and take corrective action.
|
|
|
Elements on a Cause and Effect Diagram (fishbone)
|
1. Materials
2. Manpower 3. Machinery 4. Method |