![]()
![]()
![]()
Use LEFT and RIGHT arrow keys to navigate between flashcards;
Use UP and DOWN arrow keys to flip the card;
H to show hint;
A reads text to speech;
19 Cards in this Set
- Front
- Back
|
What is a population? |
The collection of units to which we want to generalize a set of findings or a statistical model |
|
|
What is a sample? |
a smaller (hopefully representative) collection of units from a population used to determine information about the population |
|
|
What is the mean? |
The sum of all the scores divided by the number of scores, also the value from which the (squared) scores deviate least....it has the least error |
|
|
what is the mean as a model? |
the mean is a model of what happens in the real world: the typical score. It is not a perfect representation of the data. |
|
|
What is a deviation? |
The difference between the mean and an actual data point. |
|
|
How can we calculate deviations? |
By taking each score and subtracting the mean from it
deviation = xi-x̅ |
|
|
What is the sum of squares? |
a measure of variation or deviation from the mean for a sample |
|
|
How to do calculate the sum of squares? |
By adding the squared deviations. ss= Σ (xi - x̄)^2 |
|
|
how do we calculate average variability? |
sum of squares dived by n-1. |
|
|
what is the problem with the variance calculate and how do we solve it? |
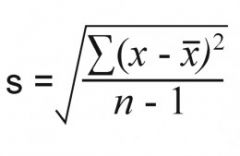
It is measured in units sqaured, this isnt very meaningful do we take the square root value. This is the standard deviation |
|
|
What does the sum of squares, variance, and standarddeviation represent? |
They all represent the same thing!! –The ‘fit’ ofthe mean to the data –The variability in the data –How well the mean represents the observeddata –Error |
|
|
How does the standard deviation effect the shape of a distribution? |
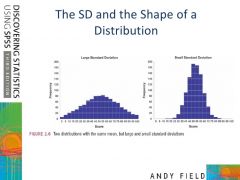
Large sd- left small sd- right |
|
|
How does the mean and sd vary in samples vs populations? |
sample : mean and sd describe only the sample from which they were calculated population: mean and sd are intended to describe the entire population sample to population: mean and sd are obtained from a sample but are used to estimate the mean and sd of the population |
|
|
what is a confidence interval? |
shows the likely range in which the mean would fall if the sampling were to be repeated. The confidence interval will get wider as the unreliability goes up. The higher the confidence that the repeat mean will fall inside the interval( the more confident you want to be); the wider the interval |
|
|
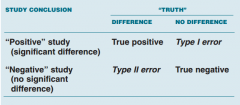
what is a type I error? |
Occurs when we believe that there is a genuine effect in our population when, in fact, there isn't. The probability is the a level (usually 0.05) |
|
|
what is the α-level? |
The null hypothesis is rejected if the p-value is less than the significance or α level. The α level is the probability of rejecting the null hypothesis given that it is true (type I error) and is most often set at 0.05 (5%). |
|
|
What us type II error? |
occurs when we believe that there is no effect in the population when, in reality there is. The probability is the β-level(often 0.2 ) |
|
|
what is β-level? |
-The beta level (often simply called beta) is the probability of making a Type II error (accepting the null hypothesis when the null hypothesis is false). It is directly related to power, the probability of rejecting the null hypothesis when the null hypothesis is false. -Frequently researchers will select a sample size and decision rule to insure that beta is 0.20 or less |
|
|
Study conclusion table- see overside |
|