![]()
![]()
![]()
Use LEFT and RIGHT arrow keys to navigate between flashcards;
Use UP and DOWN arrow keys to flip the card;
H to show hint;
A reads text to speech;
49 Cards in this Set
- Front
- Back
|
Null Hypothesis |
The opposite of the hypothesis proposed. Typically null = no difference, relationship, or effect in the compared data |
|
|
Alternative Hypothesis |
Proposed hypothesis or idea Typically = there is difference, relationship, or effect |
|
|
Alpha |
Probability of incorrectly rejecting the null hypothesis |
|
|
Type I error |
False positive Detecting a difference when there isn't one |
|
|
P-value |
Probability that the observed statistic occurred by chance convention p = 0.05 P = or < alpha; difference detected by the statistical test is unlikely occurred by chance p > alpha; observed data is due to chance |
|
|
Beta |
probability of incorrectly failing to reject the hypothesis |
|
|
Type II error |
Missed detection Failing to detect a difference when there is one |
|
|
Power |
ability of a test to detect a difference when a difference exists p = 0.8; difference will be detected 80% of the time |
|
|
Power analysis |
Method for determining how large a sample size must be to detect a difference if in fact a difference exists |
|
|
Bias |
recall bias selection bias interviewer bias Publication bias performance bias citation bias |
|
|
External validity |
A finding can be generalized beyond the samples |
|
|
Internal validity |
Research itself upholds the highest standards of quality and limits possible confounders |
|
|
Construct validity |
how well did it measure or test a specific construct |
|
|
Inter-rater reliability |
the extent of agreement between two or more raters |
|
|
Test-retest reliability |
The degree to which test or instrument scores are consistent from one point in time to the next (the test taker and test conditions must be the same at both points in time) |
|
|
Internal Consistency reliability |
The consistency of responses across items on a single instrument or test |
|
|
sensitivity |
Proportion of positives that are correctly identified |
|
|
specificity |
proportion of negatives that are correctly identified |
|
|
Student T test |
Compares two groups. Independent variable = categorical Dependent variable = continuous |
|
|
Mann Whitney U |
non-parametric equivalence of student t-test when: 1) n<30 2) non-normal or highly skewed data |
|
|
Paired T-test |
Compares two samples at a different time (pre, and post-test) |
|
|
Wilcoxon Matched-pair Test |
non-parametric equivalent of the paired t-test |
|
|
ANOVA |
Compares 3 groups of sample Independent variable = categorical Dependent variable = continuous |
|
|
Kruskal- Wallis One Way ANOVA |
Non-parametric equivalent of the ANOVA
used if the continuous variable is made into categorical variable |
|
|
Bonferonni Correction |
An approach to reducing the statistical significance level when multiple comparisons are made on the same set of data |
|
|
One Sample T-test |
Compares sample mean of a single group to the population mean |
|
|
Post-hoc Tests |
Performed after significant difference is found by ANOVA; To identify which means are significantly different from each other |
|
|
Correlation |
A statistical relationship that reflects the association between two variables •Very strong: 0.70 to 1.00 •Strong: 0.40 to 0.69 •Moderate: 0.30 to 0.39 |
|
|
Pearson correlation coefficient |
A number (rp) that represents the strength of the association/correlation between two variables |
|
|
Spearman correlation coefficient |
The nonparametric equivalent (rs) of the Pearson correlation coefficient |
|
|
Multiple regression |
Using two or more independent variables to predict a dependent variable |
|
|
Unstandardized regression coefficient (b) |
The change in the dependent variable associated with a 1 unit change in the independent variable |
|
|
Standardized regression coefficient (beta) |
Each variable is transformed to have a mean of 0 and standard deviation of 1 so that the regression coefficients represent how predictive the variable is (i.e., the magnitude of the coefficients can be compared to one another to determine which is most predictive of the outcome) |
|
|
R2 |
The amount of variance in the data accounted for by a regression model |
|
|
Confounding variable |
An extraneous variable that correlates with the dependent variable and at least one independent variable |
|
|
Odds |

|
|
|
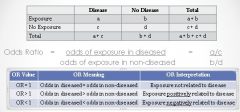
Odds Ratio |
|
|
|
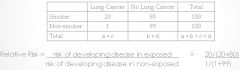
Relative risk |
|
|
|
Measure of disease association |
The magnitude of the effect of an exposure on an outcome |
|
|
Confidence Interval |
typically reported as 95%; •If the confidence interval includes the null hypothesis = 1 (i.e. “no difference”), then the results are not statistically significant •OR 1.9 (95% CI, 1.5 – 3.0) = statistically significant because CI does not contain 1 |
|
|
Chi square |
Tests categorical independent and dependent variables. Can be used for 2 or more variables |
|
|
Fisher Exact test |
Equivalent of Chi Square when n < 5 |
|
|
McNemar Test |
A test of match paired (people with same qualifiers and conditions) frequencies (e.g., frequency before and frequency after) |
|
|
Logistic Regression |
measures the relationship between a categorical dependent variable and one or more independent (categorical or continuous) variables outcome variable is dichotomous(categorical with two categories) |
|
|
Multilevel Data |
Data that represents more than one level, in which the lower level is nested within a higher level |
|
|
Multilevel model |
Statistical approach to analyzing data that represents multiple levels |
|
|
survival analysis |
A statistical analysis that models time to event data |
|
|
Dependent variable |
Output Outcome Effect of interest |
|
|
Independent Variable |
Input experimental predictor |