![]()
![]()
![]()
Use LEFT and RIGHT arrow keys to navigate between flashcards;
Use UP and DOWN arrow keys to flip the card;
H to show hint;
A reads text to speech;
33 Cards in this Set
- Front
- Back
|
Question : What does the height of the bars in a histogram represent? |
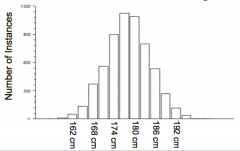
Answer : The number of instances in each category, or "bin". |
|
|
Question : How can we calculate the mean of a sample distribution? |
Answer : The mean (M) of a sample distribution can be calculated by adding together all the individual scores and dividing the sum by the sample size (n). |
|
|
Question : How can we calculate the sum of squares? |
Answer : The sum of squares (SS) can be calculated by subtracting the mean from each individual's score, squaring these differences, and then adding them all together (hence sum of squares). |
|
|
Question : For a one sample t test how can we calculate the degrees of freedom? |
Answer : |
|
|
Question : For a repeated measures t test how do you calculate the degrees of freedom (df)? |
Answer : df = n-1 where n = sample size |
|
|
Question : For an independent measures t test how do you calculate the degrees of freedom (df)? |
Answer : df = nA + nB - 2, where nA is the size of sample A and nB is the size of sample B. |
|
|
Question : How do we calculate the variance of a sample distribution? |
Answer : The variance (s^2) can be calculated by dividing the sum of squares (SS) by n-1. (Note: "^2" means "squared") |
|
|
Question : How do we calculate the standard deviation of a sample distribution? |
Answer : |
|
|
Question : Which two statistics do we use to describe a distribution of a sample or population of individuals? |
Answer : |
|
|
Question : What percentage of individuals in a normally distributed population will be within 2 standard deviations of the mean? |
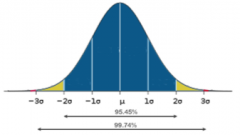
Answer : 95.45% |
|
|
Question : What is a distribution of individuals? |
Answer : A distribution of individuals is the distribution of the values of individual members of a sample (e.g., the distribution of the height of every adult in a town). |
|
|
Question : What is a distribution of means? |
Answer : A distribution of means is the distribution of the means of multiple samples taken from the population (e.g., the distribution of the mean height of 20 adults from a particular town where this mean height is calculated multiple times from multiple samples.). |
|
|
Question : |
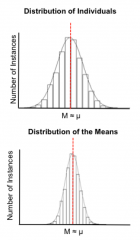
Answer : While both distributions can be expected to centred around the population mean, the distribution of means crucially has less variance than the distribution of individuals. |
|
|
Question : What is the standard error and why is it important? |
Answer : The standard error is the standard deviation of the distribution of means, and it is important because it tells us about the variation in sample means. |
|
|
Question : |
Answer : H0 is the null hypothesis and H1 is the alternative hypothesis. Initially, you assume the null hypothesis is true and, on this basis, calculate the probability of measuring a sample mean (M) that deviates from the mean predicted by H0 as much or more than what you actually did measure. If this probability is very small, you conclude that H0 cannot be true, and reject it in favour of H1. |
|
|
Question : |
Answer : The t statistic represents how much greater (or less) the sample mean (M) is than the hypothetical mean (μ), relative to the standard error. If the value t statistic is large that implies, relative to the standard error, the difference between M and μ is large. |
|
|
Question : If the calculated value of the t statistic is less than the critical value can you conclude that the null hypothesis (H0) is true? |
Answer : You can conclude from your data that you are unable to reject H0. It might be that H0 is actually true, but it also might be that it is false and you just didn’t run enough subjects to prove this. You just don’t know. All you can say is that you were unable to reject H0. |
|
|
Question : What is a significance level? |
Answer : This significance level indicates the probability that, if you reject the null hypothesis, you do so incorrectly. In other words, it is probability that you have made a type 1 error (i.e., saying that the null hypothesis H0 is false when it is in fact true). |
|
|
Question : Why do the critical values for the t statistic increase as the significance level of the test we perform increases? |
Answer : Remember, the significance level indicates the probability that we have made a type 1 error. The greater the significance level, the less likely we are to make a type 1 error and the greater the critical value needs to be to ensure that the probability of making a type 1 error is that small. |
|
|
Question : How do we decide whether to perform a one-tailed or two-tailed test? |
Answer : The answer lies in the alternative hypothesis (i.e., H1). If the H1 states that the mean differ from the hypothetical population average in only one direction (i.e., only "greater than", or only "less than"), then you need to perform a one-tailed t test. However, if H1 states that the mean is simply different (i.e., might be greater or might be less than the hypothetical average) then you need to perform a two-tailed t test. |
|
|
Question : What is the difference between a one-tailed and two-tailed test? |
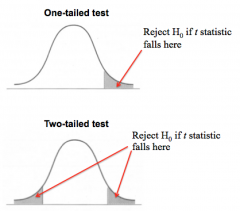
Answer : A one-tailed test only tests one tail of the distribution. E.g., It might test whether your sample mean is greater than the hypothetical population mean. A two-tailed test tests both tails of the distribution. That is, whether your sample mean is not equal to (i.e. greater or less than) the hypothetical population mean. |
|
|
Question : Why does the t statistic depend on the degrees of freedom of your test? |
Answer : To calculate the t statistic you need to estimate the variance of the sample. When your sample has only a few degrees of freedom, this estimate is not likely to be accurate. To keep the probability of making a type 1 error constant, you need to have a more conservative test – one with a larger critical value for the t statistic. |
|
|
Question : What does the effect size r^2 represent? |
Answer : The percentage of variance accounted for by the treatment (i.e., the percentage of variance accounted for by the experimental manipulation). |
|
|
Question : When should you calculate effect size? |
Answer : You should calculate effect size regardless of whether or not your result is significant. |
|
|
Question : How do you report an integer? |
Answer : Without decimal places. |
|
|
Question : How should you report a p value? |
Answer : - The leading zero should be omitted - The exact value should be reported (if you have it), even for non-significant results. The only exception is if SPSS gives you p = .000, in which case you should report p < .001 - If p = .04545, report it as .045 and not .05 to distinguish it from a p value > .05 - The "p" should be in italics (cram doesn't allow us to do that). |
|
|
Question : When can you perform a repeated measures t test? |
Answer : - When you have two conditions, and - When each sample in one condition can be paired with another sample in the other condition E.g., when you have the same subjects in both conditions. |
|
|
Question : When do you perform an independent measures t test? |
Answer : When you have independent subjects in the two conditions. |
|
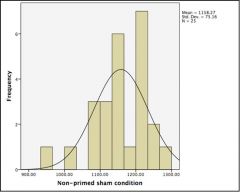
Question : Looking at this histogram, what can you assume about the presence of outliers? |
Answer : As all the data is within the region where the normal curve is > 0, you can assume that there are no outliers to be examined (and possibly removed). |
|
|
Question : How do we obtain 1-tailed p values from 2-tailed p values? |
Answer : Halve them. |
|
|
Question : What are the differences between nominal, ordinal, and scale variables? |
Answer : - A variable can be treated as nominal when its values represent categories with no intrinsic ranking (e.g., a YES/NO scale or the gender of the participant). - A variable can be treated as ordinal when its values represent categories with some intrinsic ranking (e.g., the order in which participants finish a race). Crucially, the spacing between values is not assumed to be constant (e.g. the difference between coming first and second is not necessarily the same as the difference between coming second and third. The person who has come first may have won by a lot whereas the second and third finishers may have almost the same race times - you just don't know from their ordinal rankings). - A variable can be treated as scale when its values are ordinal but the difference between two points on the scale is meaningful (e.g., time taken to complete a race). |
|
|
Question : What type of variable (i.e., measure) are reaction times? |
Answer : The variable reaction times is scalar (aka scale in SPSS speak). |
|
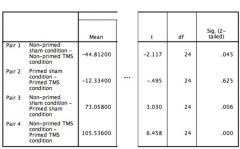
Question : Looking at a cropped version of this SPSS output, how would we report the p value for comparing between the non-primed sham condition and the non-primed TMS condition (pair 1)? |
Answer : p = .045 (the "p" should be in italics but cram will not allow us to do that). |