![]()
![]()
![]()
Use LEFT and RIGHT arrow keys to navigate between flashcards;
Use UP and DOWN arrow keys to flip the card;
H to show hint;
A reads text to speech;
29 Cards in this Set
- Front
- Back
|
Do AET and PET bear significant differences, or are they relatively the same statistics? |
Relatively the same statistics |
|
|
Describe the relationship between tree species richness and latitude, precipitation, PET, and AET. |
As PET, AET, and precipitation increase, tree species richness increases as well (direct relationship). However, as latitude increases, tree species richness decreases (inverse relationship). |
|
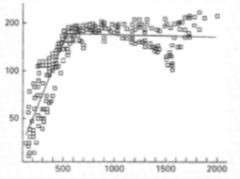
What does this graph represent? |
The relationship between aves species richness and Potential Evapotranspiration; as PET increases, aves species richness increases until PET reaches 500 mm/y, and then the species richness levels off |
|
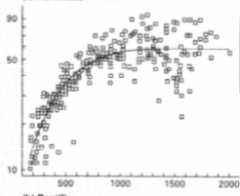
What does this graph represent? |
The relationship between mammalian species richness and PET; as PET increases, mammal species richness increases up until PET reaches ~750-1000 mm/y. It then begins to level off. |
|
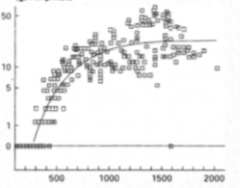
What does this graph represent? |
The relationship between amphibian species richness and PET; as PET increases, species richness increases up until PET reaches ~750-1000 mm/y. It then begins to level off. |
|
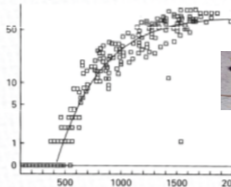
What does this graph represent? |
The relationship between mammalian species richness and PET; as PET increases, mammal species richness increases up until PET reaches ~1250-1500 mm/y. It then begins to level off. |
|
|
In terms of productivity and species richness, what is the difference between a tropical environment (near the equator) and a tundra environment (near the North Pole). |
The northern environments have both low productivity and low species richness, while the tropical environments have both high productivity and high species richness |
|
|
Explain the competition theory in terms of temperate and tropical latitudes? |
Competition is much higher in the tropics than the temperate environments, causing much higher biodiversity in the tropics |
|
|
Explain the climate variability theory
|
There is less variation in the tropics, which allows for more year-round specialization |
|
|
Explain the spatial heterogeneity theory |
By looking at a smaller scale, we can see a greater amount of biodiversity and species richness than if we were to take a picture from a plane; this is because we have greater definition. |
|
|
Give an example of spatial heterogeneity |
If you were to take a plane picture of the ocean, you'd probably see orcas and whales the best; however, when you zoomed in to a more specific area, you'd probably be looking for sea lions and otters because they are smaller |
|
|
Fill in the blanks for both temperate and tropical latitudes: _______ plant species leads to ________ herbivore species which leads to _______ predator species |
Temperate: few plant species leads to few herbivore species which leads to few predator species Tropical: many plant species leads to many herbivore species which leads to many predator species |
|
|
At Ten Mile Point, what is the relationship between amphibian/reptile species and tree species? Which one is more likely to be directly correlated with the tree species richness? |
As tree species richness increases, the number of reptile and amphibian species increases. Amphibian species tend to be much more linearly directly related. |
|
|
Explain the environmental age theory on the island of Krakatau |
As environments increase with age ( as the years go by) the number of species increases due to factors such as dispersal and colonization |
|
|
Rank the following from highest to lowest impact on number of species of plants in terms of the island of Krakatau: wind dispersal, bird dispersal, and water dispersal. |
Wind dispersal > Bird dispersal > Water dispersal |
|
|
What is the Geological time and cladogenesis theory? |
Geographical isolation + natural selection + geological time = cladogenesis |
|
|
What is the average length of time for the creation of a new species? |
Average of 1 million years (but can be as short as 1000y) |
|
|
What are the 6 major explanations for differences in species richness? |
1. Primary productivity 2. Competition 3. Climate Variability 4. Spatial heterogeneity 5. Environmental age 6. Geological time |
|
|
Who proposed the Diversity-stability hypothesis and what does it state? |
Charles Elton's diversity-stability hypothesis states that stability has a direct relationship on the number of species present (i.e. a linear graph) |
|
|
Who proposed the rivet hypothesis and what does it state? |
Paul and Anne Erhlich's rivet hypothesis states that at very low numbers of species, the stability increases dramatically and then begins to level off |
|
|
Who proposed the redundancy hypothesis and what does it state? What else can it be called and why? |
Brian Walker's redundancy hypothesis states that stability is practically unrelated to species numbers, barring one keystone species. This can also be called the passenger hypothesis because if you were to throw out any passenger in a plane, the plane would still fly, but if you threw out the pilot, you would kill everyone on board. |
|
|
What could you expect in terms of species numbers based on similar habitats with different sizes? |
The number of species in a habitat would increase as size of the habitat increases |
|
|
What could you expect in terms of species numbers based on similar habitats with similar sizes, but on islands going further from the mainland? |
The number of species would decrease the farther from the mainland you got |
|
|
Describe the relationship between extinction, small islands, and small population size |
Extinction increases on small islands and/or small population sizes |
|
|
What is ecological disharmony? |
Ecological disharmony is non-representative proportions of some species |
|
|
What kind of species are represented by ecological disharmony? |
Mainly species with good dispersal
|
|
|
True or false: predators with high extinction rates are usually present on small islands |
False; as they have higher extinction rates, predators experience higher competition and therefore die off faster, meaning they're usually absent on small islands |
|
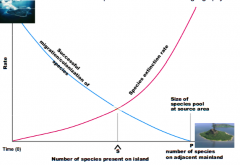
Who created this graph, what is it called, and what does it represent? |
The graph is MacArthur and Wilson's Equilibrium Model of Island Biogeography; it shows that as less species successfully colonize an island, their species extinction rate increases. S is the prime spot in which most occur |
|
|
What are the three essential features of the equilibrium theory? |
1. Number of species moves towards an equilibrium between extinction and colonization as a function of island area and distance 2. At equilibrium, actual species composition is in continuous state of change as some species go extinct and new species colonize 3. You can predict the number of species but not species composition |