![]()
![]()
![]()
Use LEFT and RIGHT arrow keys to navigate between flashcards;
Use UP and DOWN arrow keys to flip the card;
H to show hint;
A reads text to speech;
73 Cards in this Set
- Front
- Back
|
Where does ecology fit into biological levels of organization. |
An organism is a certain specie, a group of species make a population, a group of separate populations make up a community. A community interacts its ecosystem for nutrients. Ecosystems interacting with each other make a landscape. Ecology is organisms interaction with environment. |
|
|
What are some Physical Characteristics that determine what communities live in a particular biome. Try to give an example of each characteristics. |
Nutrients, Temperature, Energy, Space and water are Physical Characteristics. A community to survive there has to be a nutrients for organisms to live off. Temperature determines what communities live in that biome, an example is how close to the sea current (Gulf of Mexico) or how far north. A hierarchy of energy, food chain example is too many lions no enough prey(omnivores), too many omnivores not enough food. Too much food increase populations, community to big for its ecosystem not enough space. Water is building blocks of all life, Human body is mostly made of water. Communities need certain water to survive, that can be changed by Ph and temperature. Water determines what communities live that biome. |
|
|
Examples of Aquatic Communities, Fresh Water, how do they differ. What is Dry Land |
Lake is bigger deeper, ponds are smaller and shallower. River are bigger/wider and deeper, streams a narrow and shallow. Swamps has trees and marshes does not. Bogs are acid and fens are Alkali(rich soil). Succession is dry land. |
|
|
What is the different between Oligotrophic vs Eutrophic, examples of each. |
Oligotrophics poorly feed low nutrients, having a high oxygen content owing to the low organic content(Deep cold, clear). Eutrophic has a lot of food and an abundant of nutrients that gives dense growth( Shallower water, vegetation). An example of Oligotrophic environment is Lake Tahoe and Lake Superior. A example of a Eutrophic lake is our Campus Lake at JJC and Lake Erie. |
|
|
Examples of Aquatic Communities, Saltwater. |
Estuaries is where fish spawn breed and sunlight provides plants growth food. Salt marches are associated with estuaries, grass growing. Rocky Shores home to invertebrates. Coral reefs are effected by acid rain and sediment. Pelagic means open water. Benthic means deep water. |
|
|
Define Succession. What is the difference between Primary and Secondary Succession. |
Succession is sequences of communities which prepare the way for the next community biomes are final stage or climax communities (stable & diverse). Primary Succession Rock -> lichens mosses(soil)-> ferns-. shrubs& trees. Secondary Succession, succession following a disturbance, fie, farm field/ cement parkinglot. ( Reality this process is much more complex and we cannot predict the end result). |
|
|
Mountains Significance. |
Rain shadows. Latitudinal change Tropical->Tundra->Ice cap. Altitudinal change Tropical->Tundra->Ice cap.Latitudinal and Altitudinal is directly the same. |
|
|
Distribution of species. |
Dispersal, Biotic factor, Abiotic factor, and Patterns of Dispersion ( Clumped "problems with quadrate samping", Uniformed, Random). |
|
|
Define Population |
Members of the same species living in same habitat - do the same thing ( role = niche) job. 1st identify dichotomous key. 2nd sample by count, quadrate sample, mark& recaptured. |
|
|
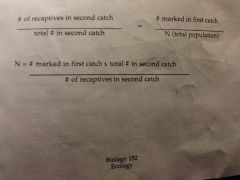
N=Population Size. How to find N? |
|
|
|
Population Change over time.What causes Change? |
Birth (b) and Death (d) rate. Rate of natural increase = r=0 Zero population growth r>0 growing r<0 decling r= b-d/N = 40-10/100= .3 x100= 30% |
|
|
Increasing Logarithmic or * exponential growth. |
Increase = I or DeltaN/DeltaT= rN .3 x100 = 30 .3 x130 = 39 .3 x169 = 50.7 .3 x219 = 66 Example. Bacterium |
|
|
Bacterium |
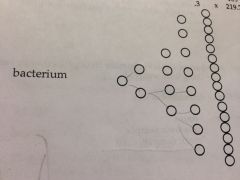
exponential growth |
|
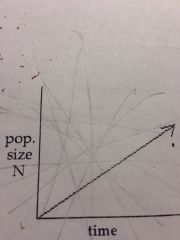
What Kind of increase. |
Linear Increase. |
|
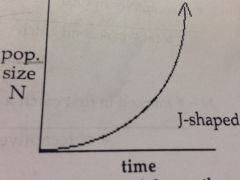
What Kind of increase. |
Exponential Growth. |
|

What Kind of increase. |
Logistics Curve or S Shape Curve. |
|
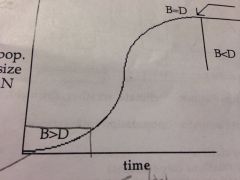
The arrow that is pointed is known as K, what is K. |
K= carrying Capacity When N= K , I = 0 no growth. |
|

If a species is in zone B>D. This is known as what. |
An endangered specie, bad news low genetic variation "Danger Zone". |
|
|
Practical Application. Fisheries,pests, endangered species. |
Fisheries want maximum sustainable yield harvest at inflection point.
Pests such as rats and mosquitoes decrease K. Endangered Species increase K- avoid lag period. |
|
|
What factor determine the environmental resistance increases with increasing density. |
Foods, Habitats space, Competition, Disease and Human Predators. |
|
|
Type I: Survivor ship Curve |
Large mammals, parents have few offspring, most offspring will survive till old age. Parental care |
|
|
Type II: Survivor ship Curve |
Rodents & birds, a lot of offspring that will survive survive till old age. Some parental care |
|
|
Type III: Survivor ship Curve |
Invertebrates; large offspring. Little parental care,most don't survive, very few. |
|
|
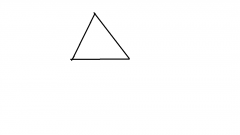
Age Structure |
A. Alot of pre-reproduction= increase population. B. Alot of reproduction= population increase. C. Alot of post-reproduction= decrease population. |
|
What kind of population. |
Expanding, increasing population. |
|

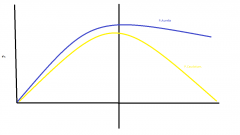
What kind of population. |
Stable, population at the same rate. |
|

What kind of population.
|
Decreasing, population decreasing. |
|
|
R selected Populations |
(tapeworms)
1. J-shaped growth curve 2. little parental care 3. Type III Survivorship curve 4. unstable population #’s 5. variable environment |
|
|
k-selected populations |
(elephants)
1. S-shaped curve 2. a lot of parental care 3. Type I Survivorship curve 4. stable population #’s 5. stable environment |
|
|
Density Dependent Factors:
|
population interactions:more pronounce the higher number of individuals. |
|
|
Developed Countries Mdc |
Medical Revolution, decrease death rate. Industrial Revolution, decrease death rate. Growth Rate 1% population size 20%. Age pyramid Stable. Resource consumption- high per individuals. |
|
|
Developing Countries Ldc. |
Medical Revolution, decrease death rate. Growth Rate 1.7% declining. Population Size 80 %. Resource consumption- high number of individuals. Age Pyramid, expanding. |
|
|
Environmental Impact= |
population sizeX resources used per personX pollution per unit resources used |
|
|
Ecological Footprint
|
# of acres to produce resources and absorb wastes. 4-5 acres per person available U. S. uses 20 acres per person?????
|
|
|
Zero population growth
|
High birth rate and high death rate? Low birth rate and low death rate? Social change or increased mortality due to resource limitation,plagues wars, and environmental degradation????? |
|
|
Density Dependent Factors that InfluencePopulation Growth. |
A. Competition B. Predation C. Symbiosis: D. Self poisoning,yeast E. Psychogenic effects (biotic & abiotic factors). White foot mice. F. Herbivory. |
|
|
A. Competition |
1. intraspecific: within a species- territories- dominance hierarchies. ( Radish vs Radish) 2. interspecific: between species ( Radish vs Wheat) 3. Gause’s Exclusion Principle or the Law of Competitive Exclusion:when 2 species over lap completely in their niche they cannot coexist for long (one will out compete the other. |
|
|
B. Examples of Competiton. |
Paramecium aurelia vs. P. caudatum. Paramecium aurelia out competes P. caudatum. |
|
|
Connel’s study of barnacles: Chthamalus under lab condition. |

|
|
|
Connel’s study of barnacles: Balanus lab condition. |

|
|
|
Connel’s study of barnacles: Chthamalus vs.Balanus |
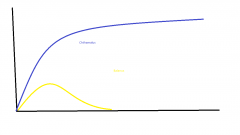
Removal of Balanus along Scottish coast. Increased Chthamalus. |
|
|
Human introduction of Alien Species. |
-buck thorn -Asian Lady Bug -Garlic Mustard -Asian Carp ALL out compete the native species. |
|
|
In natural environment competition often does not occur because of resource partitioning. |
1. Cape May Warblers- Figure 45.2 in book. 2. Lizard- Figure 54.2 in book. 3. Zooplankton.( size selected carnations). |
|
|
Predation |
Energy Cost ( Finding, Capturing, Consuming) prey< Energy Gain (Prey Digestible, biomass and calories) Prey evolve to increase costs and predators evolve todecrease costs (co-evolution). |
|
|
Anti predator defenses to increase cost:
|
a. Spines b. Toxins c. concealment d. Fright e. warning colorationmimicry Bastesian (flower fly longhorn beetle) “cheaters”- Müllerian (group of organism all dangerous bumblebee, yellow jacket. |
|
|
Effects of Predation
|
a. Wipe out preyParamecium sp vs. Didinium sp.(wipe out other in lab/ not in lake).
b. Increase diversityPaine’s Keystone predator Piaster(remove starfish) vs Mytilus(took over) c. Prey CyclesLynx (causing the hare prey to decline)cycle vs. hare ? d. Stabilize: wolves & moose on Isle Royale deer in Illinois: nopredator |
|
|
Describe abiotic factors |
temperature,sunlight,nutrients,pH etc. |
|
|
Describe communities |
#’s & types of organisms Diversity: species richness and relative abundance
Shannon Diversity Index harsh vs. favorable environment |
|
|
Study
|
flow of energy= food,
flow of materialsCHNOPS = food, at ecosystem level as opposed to cellular ororganismal |
|
|
Describe trophic structure
|
a.Producers:(algae) plants, bacteria (autotrophs)’ b.Primary Consumers:animals (heterotrophs-et producers)herbivores – grazers c.Secondary Consumers:carnivores & omnivores (feed on producer and primary consumers) d.Tertiary Consumers:carnivores & omnivores(feed on secondary and primary consumers) e. Decomposers: detritoveres bacteria & fungi recycle materials |
|
|
Food Chains vs. Food Webs |
Food chains grain->cattle-> humans grasses-> lemmings-> arctic fox = exchange of energy & materialsfood chains tend to be unstable(take out one member falls apart no idea.) Food Webs complex webs more stable |
|
|
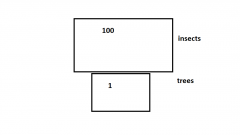
Eltonian Pyramids ,numbers, grasslands
|

|
|
|
Eltonian Pyramids ,numbers, forest |
|
|
|
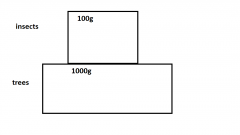
Eltonian Pyramids , biomass, forest |
|
|
|
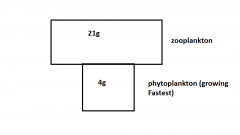
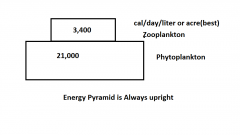
Eltonian Pyramids , biomass, aquatic |
|
|
|
Eltonian Pyramids , energy flow, aqautic |
|
|
|
Why Does Energy Always Decrease. |
1000 cal sun-(1%)> 10 cal plant-(10%)> 1 primary consumer-(10%)>.1 secondary consumer. 1000 cal sun-> 10% transmitted, 10 % reflected, 79 % absorbed by non photosynthetic parts of plants. 10 cal plant -> respiration, non digestible woody parts. 1 primary consumer-> respiration,wastes, heat, non digestible (Bones & fur ) * note energy does not cycle need a continuous sources of energy sunlight(usually) |
|
|
At what trophic level is it most efficient to feed?Why aren’t there many top predators? |
Primary, Not enough energy. |
|
|
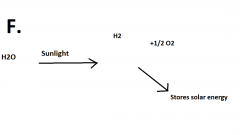
Carbon Cycle |
The plant removes CO2 by photosynthesis. CR=(cellular respiration). Plants do CR(release of CO2). Animals eat plants, animals do CR(release of CO2). Plants and animals die,(dead bodies + waste pool) turned into fossil fuels. The combustion of fossil fuels (release of CO2).Plant and animals dies, Bacteria and Fungi decomposition,they do CR(release of CO2). |
|
|
Nitrogen Cycle |
Nitrogen fixing bacteria taking N2 from the plants. Plants(NO2) are eaten by animals. Plants and animals die,(dead bodies + waste pool). Denitrifies(release N2). |
|
|
Environmental Concerns
|
A. Environmental Degradation
B. Land Use C. Loss of Biological Diversity D. Land Pollution e. Water Pollution F. Air Pollution G. Energy Choices |
|
|
Environmental Degradation |
1. Pollution: contamination ofenvironment by introducingimpurities2. Depletion of Resources3. Disturbance of Natural Conditions
|
|
|
Land Use
|
1. Urbanization
20% in cities in 1950 50% in cities in 2000 destruction of wetlands & croplands(no easy replace) 2. Cropland & Rangeland soil erosion desertification strip mining 3. Forests:deforestation - slash & burn - logging - cattle ranching |
|
|
Loss of Biological Diversity
|
20% species extinct by 2000 Reasons 1. habitat destruction 2. hunting & collecting 3. predator control 4. pesticides & herbicides “BroadSpectrum” |
|
|
Land Pollution:Household trash |
2.75 lb/day 1920 8lb/day 1980 disposal: open dumps, sanitarylandfills, incineration alternatives: recycle/fuel} creates jobs |
|
|
Land Pollution:Hazardous Wastes |
A. heavy metals ( lead and mercy denature enzymze, toxic) B. chlorinated hydrocarbons: PCB’s C. nuclear wastes: radioactive 239 Plutonium: 200,000 years! D.problems: non biodegradable bio accumulation: DDT & PCB’s( non polar) |
|
|
Water Pollution: H2O quality. |
A. chemical& physical characteristics B. animal & plant diversity C. biomass & productivity D. stability (abundance of species) |
|
|
Water Pollution: Eutrophication. |
A. oxygen demanding wastes sewage B. plant nutrients (fertilizers) C.soil erosiond D.Thermal discharges (add nutrients) |
|
|
Water Pollution: Health Hazards. |
A. disease causing agents B. organic compounds:oil spills/pesticides C. inorganic compounds:acids, salts, heavy metals D. radioactive substances E. Pharmaceuticals F. Endocrine disrupters
|
|
|
Air Pollution. |
Troposphere: 78% N,21% O,2.3% CO2 Stratosphere: ozone = O3 15 km – 50 km radioactive shield. 1. CFC’s (chloroflourocarbons): break down ozone shield 4-5% decade! 2. Photo chemical Smog: nitrogen oxides hydrocarbons light decreases PAN & Ozone cancer & other respiratory problems |
|
|
Thermal Inversion; Acid Deposition, Global Warming, Indoor Air Pollution. |
Sulfur and Nitrogen Acid, Kills vegetation, sterilizes the soil. No big deal in IL big deal in CA. |
|
|
Energy Choices:Nonrenewable |
A. Fossil Fuels: petroleum/natural gas/coal} 30 years?
B. Nuclear: fission, uranium 235*no air pollution meltdowns? radioactive wastes? fuel rods mill tailings |
|
|
Energy Choices: Renewable
|
Does no produce pollution. a. solar b. falling H2O c. geothermal d. wind e. oceans |