![]()
![]()
![]()
Use LEFT and RIGHT arrow keys to navigate between flashcards;
Use UP and DOWN arrow keys to flip the card;
H to show hint;
A reads text to speech;
114 Cards in this Set
- Front
- Back
|
Nominal GDP (unadjusted) |
- measures the value of all final goods & services in current prices - NOT adjusted for inflation |
|
|
Real GDP |
- measures value of all final goods & services in constant prices, adjusted for changes in the price level (inflation) = (nominal GDP)/ (GDP deflator) X 100 |
|
|
Leading Indicators (type of economic indicator) |
- predicts econ activity - EX: orders for goods |
|
|
Lagging Indicators (type of economic indicator) |
- follows econ activity - EX: CPI for services |
|
|
Coincident Indicators (type of economic indicator) |
- change at generally the same time as the whole economy - EX: industrial production GDP |
|
|
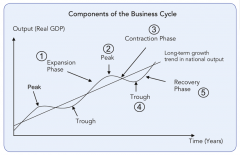
Components of the Business Cycle |
|
|
|
Aggregate Demand Curve |
- indicates the maximum quantity of all goods and services that households, businesses, and government (consumers) are willing and able to purchase at any given price level |
|
|
Aggregate Supply Curve |
- indicates maximum quantity of all goods and services that producers are willing and able to produce at any given price level |
|
|
Multiplier Effect |
-an increase in consumer, business or gov't spending generates a multiplied increase in the level of economic activity - change in real GDP = 1/ (1- MPC) MPC = marginal propensity to consume |
|
|
Gross Domestic Product (GDP) |
- measure of all output and performance of a nation's economy - includes all final goods and services produced by resources within a country, regardless of what country owns the resources |
|
|
Expenditure Approach |
Government purchases Gross domestic Investment Personal Consumption Net Exports |
|
|
Income Approach |
Income of proprietors Profits of corporations Interest (net) Rental income Adjustments for net foreign income & misc items Taxes Employee compensation Depreciation |
|
|
Gross National Product (GNP) |
-measure of the market value of all final goods and services produced by the residents of a country, regardless of whether or not the resident produces the goods or services domestically or abroad |
|
|
Net National Product (NNP) |
= GNP - depreciation |
|
|
National Income |
= NNP - indirect business taxes |
|
|
Personal Income |
-income received by households and noncorporate businesses |
|
|
Disposable Income |
= PI - personal taxes |
|
|
Unemployment Rate |
= (# of unemployed/ total labor force) x 100 |
|
|
Labor Force |
- all individuals 16 years of age and older who are either working or actively seeking work |
|
|
Frictional Unemployment |
-normal unemployment due to turnover, etc - always exists |
|
|
Structural Unemployment |
- jobs available do not match skills - always exists |
|
|
Seasonal Unemployment |
-results from seasonal change in labor demand - always exists |
|
|
Cyclical Unemployment |
- results from a decline in real GDP during contraction or recession |
|
|
Natural Rate of Unemployment |
= frictional unemployment + structural unemployment + seasonal unemployment |
|
|
Philips Curve |
- demonstrates the inverse relationship between the rate of inflation and unemployment - when unemployment is high/very low, inflation tends to be low/high - changes in AD |
|
|
Inflation |
- sustained increase in general prices of goods and services |
|
|
Deflation |
- sustained decrease in general prices of goods and services |
|
|
Consumer Price Index (CPI) |
-measures the overall cost of a basket of goods and services purchased by an average household during a given period of time = (current cost of the market basket/ base year cost of the market basket) x 100 |
|
|
Inflation Rate |
= [(CPI^this period) - (CPI^ last period)] / (CPI ^ last period) * 100 |
|
|
Producer Price Index |
- overall cost of a basket of goods and services typically purchased by businesses |
|
|
Demand - Pull Inflation |
- caused by increases in aggregate demand (i.e. due to an increase in wealth) |
|
|
Cost- Push Inflation |
- caused by reductions in short-run aggregate supply (i.e. due to a rise in oil prices) |
|
|
Cyclical Budget Deficit |
- results from temporarily low economic activity - during contractionary phases, but will improve when econ expands |
|
|
Structural Budget Deficit |
- results from a structural imbalance between government spending and revenue - not enough tax money to cover expenses |
|
|
Nominal Interest Rates |
- amount of interest paid or earned measured in current dollars - NOT adjusted for inflation |
|
|
Real Interest Rates |
= nominal interest rate - inflation rate |
|
|
M1 |
- coins, currency, checkable deposits, and traveler's checks - most liquid |
|
|
M2 |
- includes M1 - CDs less than $100k, money market deposits at banks, mutual fund accounts, and savings accounts |
|
|
M3 |
- includes M2 - time CDs of deposit of $100k or more |
|
|
Expansionary Fiscal Policy |
- money supply up, real GDP up, unemployment down - taxes down, spending up - increase AD --> recession |
|
|
Contractionary Fiscal Policy |
- money supply down, real GDP down, unemployment up - taxes up, spending down - decrease AD --> inflation |
|
|
Open Market Operations (The Federal Reserve & Monetary Policy) |
- manner in which fed controls the money supply -buying and selling government securities |
|
|
Changes in the Discount Rate (The Federal Reserve & Monetary Policy) |
- manner in which fed controls the money supply - interest rate for short - term loans to member banks |
|
|
Changes in the Required Reserve Ratio (The Federal Reserve & Monetary Policy) |
- manner in which the Fed controls the money supply - fraction of bank deposits held in reserve --> (keep money on hand) |
|
|
Increase in Money Supply = Decrease in Interest Rates |
- expansionary to combat recession -purchasing gov't securities - lowering the discount rate - lowering the required reserve ratio - AD up, GDP up, unemployment down, price up |
|
|
Decrease in Money Supply = Increase in Interest Rates |
- contractionary --> combat inflation - selling government securities (take $ out of econ) - increasing the discount rate (banks borrow less) - increasing the required reserve ration (banks have to hold more $ in reserve) - AD down, GDP down, unemployment up, price down |
|
|
Stimulate Econ during a Recession |
- increase the money supply, causing interest rates to fall, real GDP to rise, the unemployment rate to decline, and the price level to rise |
|
|
Control of Inflation |
- decrease the money supply, causing interest rates to rise, real GDP to fall, the unemployment rate to rise, and the price level to fall |
|
|
Fiscal Policy |
- government spending and tax policies |
|
|
Monetary Policy |
- supply of money |
|
|
Impact of Globalization on Companies |
- deeper integration with the world's economies - increased specialization |
|
|
Methods of Conducting International Business Operations |
- international trade - licensing - joint ventures - direct foreign investment - global sourcing |
|
|
Inherent risks of International Business Operations (downsides) |
- transaction, economic, and translation risks due to exchange rate fluctuations - health of foreign policy - political risk |
|
|
Shifts in Economic Balance of Power |
- unipolar distributions of power anticipate the USA as the only superpower - econ growth of emerging nations such as Brazil, Russia, India and China (BRIC), will shift the balance of power and introduce a multipolar distribution of power - functional interdependence of nations (participation in worldwide institutions such as the World Trade Organization and the UN) provides the opportunity to effectively address the risks associated with systemic interdependence (climate change and nuclear proliferation) - developed/emerging nations have generally produced deficits/surpluses |
|
|
Fundamental Law of Demand |
- the price of a product/service and the quantity demanded of that product/service are inversely related due to the; substitution effect & the income effect - i.e. price goes up, quantity demanded goes down and vice versa |
|
|
Substitution Effect |
-consumers tend to purchase more/less of a good when its price falls/rises |
|
|
Income Effect |
- when prices are lowered (income kept constant), consumers will purchase more of the lowered-price products |
|
|
Factors that Shift Aggregate Demand (macro) |
- changes in; - ^consumer wealth, __ ^ - ^real interest rates, __ down - ^expectations regarding future econ outlook, __^ - ^exchange rates (currency appreciates), __^ - ^government spending, __^ - ^consumer taxes (personal income taxes) , __ down |
|
|
Factors that Shift the Demand Curve (micro) |
- changes in; Wealth ^, __ ^ price of Related goods (subs ^ & comps \/) __^ consumer Income ^, __ ^ consumer Tastes or product prefs ^, __ ^ consumer Expectations (future price ^, __^ now) Number of buyers served in the market ^, __ ^ |
|
|
Fundamental Law of Supply |
- price and quantity supplied are positively related - P^, Qsupplied ^ - P\/, Qsupplied \/ |
|
|
Factors that Shift the Short-Run Aggregate Supply |
- changes in input (resource) prices - supply shocks, plentiful |
|
|
Factors that Shift the Supply Curve |
price Expectations of supplying firm product Costs price or demand of Other goods Subsidies or taxes product Technology |
|
|
Equilibrium price and output "Market's clearing price" |
-point on the graph where the supply and demand curves intersect |
|
|
Changes in Equilibrium |
pg. BII, CII |
|
|
Price elasticity of demand |
= % change in quantity demanded/ % change in price |
|
|
Inelastic demand |
- few/no subs - < 1.0 - EX: medicine, gas |
|
|
Elastic Demand |
- many subs - > 1.0 |
|
|
Unit elastic demand |
- = 1.0 |
|
|
Price elasticity of supply |
= (% change in quantity supplied)/ (% change in price) |
|
|
Inelastic supply |
- resource constraints - < 1.0 |
|
|
Elastic Supply |
- ability to store goods - > 1.0 |
|
|
Unit elastic supply |
- = 1.0 |
|
|
Cross Elasticity of Demand (supply) |
= (% change in number of units X demanded [supplied])/ (% change in price of Y) - 2 diff goods - positive coefficient indicates substitute goods EX: when price of Y increases, demand for X increases i.e coke v. pepsi - negative coefficient indicates complement goods EX: when price for a good increases, demand for related goods decreases |
|
|
Income elasticity of demand |
= (% change in # of X demanded [supplied]) / (% change in income) - if positive, then the good is normal good - if negative, then the good is an inferior good |
|
|
Av. Fixed Cost |
= FC/unit(Q) |
|
|
Av. var. cost |
=VC/unit(Q) |
|
|
Av. tot. cost |
= TC/unit (Q) |
|
|
Marginal Cost |
= change in TC/ change in Q - MC cost of 100th unit = (cost of producing 100 units) - (cost of producing 99 units) |
|
|
Long-run Production Cost |
- in the long-run are variable with the long-run average total cost (LRATC) curve being U-shaped |
|
|
Perfect Competition |
- most competitive - a large number of firms - very little product differentiation - no barriers to entry - firms are price takers (price set by market) |
|
|
Monopolistic Competition |
- a relatively large number of firms - differentiated products sold by the firms in the market (consumers can perceive diffs) - few barriers to entry - firm has control over quantity produced with price set by the market |
|
|
Oligopoly |
- very few firms selling differentiated products - fairly significant barriers to entry - firms are interdependent ( i.e., the actions of one firm affect the actions of other firms) - firms face kinked demand curves (match price cuts; ignore price increases |
|
|
Monopoly |
- least competitive - a single firm in the market - significant barriers to entry - no sub products for the good - the ability of a firm to set output and prices |
|
|
Factors that influence strategy |
- internal factors (Strengths and Weaknesses) - external factors (Opportunities and Threats) |
|
|
Porter's 5 Forces |
- barriers to market entry - market competitiveness - existence of sub products - bargaining power of customers - bargaining power of suppliers |
|
|
Cost Leadership Strategies |
- entity produces at a lower cost - broad range of buyers - narrow range (niche) of buyers - successful in markets where buyers have large bargaining power and price competition exists |
|
|
Differentiation Strategies |
- "better" product than competitors - broad range of buyers - narrow range (niche) of buyers - successful in markets where customers see value in individual products |
|
|
Best Cost Strategies |
- combines cost leadership and differentiation strategies - successful when generic products are not considered acceptable but customers are sensitive to value |
|
|
Focus/Niche Strategies |
- focus is on satisfying a particular customer segment (niche) - successful when niche is large enough so that firm can generate a profit |
|
|
Value Chain Analysis |
- helps a company meet or exceed customer expectations - internal costs analysis - internal differentiation analysis - vertical linkage analysis (try to have a better understanding buyers & suppliers) 1. ID activities 2. ID cost drivers associated w/ each activity 3. Develop competitive advantage by either; reducing cost or adding value |
|
|
Supply Chain Management |
Supply Chain Operations Reference (SCOR) -4 main points; plan, source, make, deliver BENEFITS: - reduced inventory, warehousing, packaging costs - reduction of delivery & transportation costs - improved service & delivery times - mgmt & integration of suppliers - cross-docking (minimization of handling & storage costs) |
|
|
Interest Rate (Yield) Risk |
- investor risk - losses in underlying asset value or increases in underlying liability value as a result of changes in market interest rates - risk your investment will change in value as interest rates change & you could have a loss |
|
|
Market Risk |
- losses in trading value of asset or liability in markets; nondiversifiable risk - risk investment will lose value because general fluctuations in market/econ |
|
|
Credit Risk |
-borrower - inability to secure debt financing in a timely & affordable manner |
|
|
Default Risk |
- creditor - possibility that a debtor may not repay the principal or interest due on their debt obligation on a timely basis |
|
|
Liquidity Risk |
-investor desires to sell a security but cannot do so on a timely basis or without material price concessions - risk investor who needs cash may have to sell off investments for less than it would be able to get for those investments if it could hold them |
|
|
Stated Interest Rate |
- rate of interest charge before adjustments for compounding or market factors EX: coupon rate on bond |
|
|
Effective Interest Rate |
- actual finance charge associated with borrowing after reducing the loan proceeds for charges and fees |
|
|
Simple Interest Rate |
- amount of interest paid on the original without including compounding SI = P(i)(n) |
|
|
Compound Interest |
- amount of interest earnings or expense that is based on the original principal plus unpaid interest earnings or expense FV = P(0) (1 + i) ^n |
|
|
Required Rate of Return |
- risk free rate (time value of money) - market risk premium (compensate for general risk of econ environment) - inflation premium ( adjusts for real interest rate) - liquidity risk premium ( compensate lender/investor that they won't be able to quickly convert investment to cash) - default risk premium ( compensates borrowers might not pay back as promised) |
|
|
Exchange rate fluctuations |
Trade Factors: - inflation rates - if inflation is high in an econ, then that econ will be less attractive to investors b/c will lose value over time, demand for currency goes down - income levels - government controls --> less attractive for trade Financial Factors: - interest rates --> attractive b/c investments can earn higher return - capital flows |
|
|
Transaction Exposure |
-economic loss/gain upon settlement of a transaction in a foreign currency (risk of loss at conversion) |
|
|
Economic Exposure |
- not focused on gain/loss in individual transactions, but overall exposure of a company to gain/loss in cash flow changes |
|
|
Translation Exposure |
- potential that the consolidation of the financial statements of domestic parents with foreign subsidiaries will result in changes in account balances and income as a result of exchange rate fluctuations |
|
|
Hedging |
- financial risk mgmt technique in which an entity, that is attempting to mitigate the risk fluctuations in exposure, acquires a financial instrument that behaves in the opposite manner from the hedged item - uses financial instruments to offset expected or potential losses on foreign currency transactions |
|
|
Futures Hedges |
- entitles the holder to either purchase or sell a number of currency units for a negotiated price on a stated date -- used for smaller amounts - locks in an exchange rate |
|
|
Forward Hedge |
- owner of contract is entitled to buy or sell volumes of currency at a point in time -- groups of transactions for larger amounts - locks in exchange rate |
|
|
Money Market Hedge |
- use foreign money markets to meet future cash flow needs and mitigate exchange risks by investment in financial institutions of the foreign economy |
|
|
Currency Option Hedge |
- gives owner the option to use, if its beneficial or not - same principles as forward hedge/money market hedge |
|
|
Long-Term Forward Contract |
- used to stabilize transaction exposure over long periods |
|
|
Currency Swap |
- used to mitigate transaction exposure for longer term transactions EX: two firms may enter into agreement whereby the firms agree to swap their currencies received at a future date for a negotiated exchange rate |
|
|
Restructuring |
- less investments, inflows/outflows of foreign currencies
-reduce to mitigate |
|
|
Transfer Pricing |
- arrangements between domestic parents and foreign subsidiaries to keep local tax as low as possible |