Reading...
![]()
Play button
![]()
Play button
![]()
Use LEFT and RIGHT arrow keys to navigate between flashcards;
Use UP and DOWN arrow keys to flip the card;
H to show hint;
A reads text to speech;
46 Cards in this Set
- Front
- Back
|
What is nominal data?
|
Numbers used to classify data into groups. Generally speaking, no one group is 'better' or 'worse' than the other.
|
|
|
What is dichotomous data?
|
When only two groups are possible in nominal data.
i.e. dead or alive, male or female, normal or abnormal, disease present or absent, etc. |
|
|
What is ordinal data?
|
Numbers used to rank data.
i.e. competitions (first, second, third, etc); economic status (poor, middle class, rich); hypertension (normal, mild, moderate, severe) etc. |
|
|
What is continuous data?
|
Numeric data w/ fixed intervals b/e values.
i.e. height, weight, blood pressure, pages in a book, cholesterol level, etc. |
|
|
What kind of data analyses is this an example of?
* LDL cholesterol: “very high” (> 190 mg/dL); “high” (160-189 mg/dL); “borderline high” (130-159 mg/dL); “near or above optimal” (100 – 129 mg/dL); and “optimal” (< 100 mg/dL) |
Ordinal
|
|
|
What kind of data analyses is this an example of?
* total cholesterol: “abnormal” cholesterol (> 200 mg/dL) or “normal” cholesterol (< 200 mg/dL). |
Nominal
|
|
|
What kind of data analyses is this an example of?
* all the cholesterol measurements ranging from 1 – to 500 mg/dL |
Continuous
|
|
|
What is the mean? (as if you have to ask...)
|
"arithmetic average"; the computed sum of all individual data points, that is then divided by the sum of the number of observations.
|
|
|
What is the median?
|
The 50th percentile or the middle observation;
*i.e. the number/data point that divides the distribution of values into equal halves. |
|
|
What is the mode?
|
The value of a data set that occurs most frequently.
|
|
|
What is the spread or dispersion?
|
Statistics that describe the distribution of measurements.
|
|
|
What is the range of a spread of data?
|
The difference b/e the largest and smallest observation in a set.
*i.e. class total cholesterol: minimum value 115 mg/dl, maximum value 300 mg/dL, then range = 300-115 = 185 mg/dL |
|
|
What is a symmetrical distribution of data?
|
A graph of data that has a distribution w/ the same shape on both sides.
*occurs if the mean and median are equal. |
|
|
What is skewness?
|
Describes the horizontal distribution of the data.
*If the mean is larger than the median, the horizontal data is skewed right, and vice versa |
|
|
What is kurtosis?
|
The vertical distribution of the data.
*When data distribution is peaked the kurtosis is positive, if it is squished then it is negative |
|
|
What is the standard deviation?
|
The most common measure of dispersion or spread. It can be used w/ the mean to describe the distribution of observations.
|
|
|
How do you calculate the standard deviation?
|
Take data set numbers, find the absolute value of their deviation from the mean, square the numbers, then divide by the number of observations -1, then take the square root of that number.
|
|
|
What is normal Gaussian distribution?
|
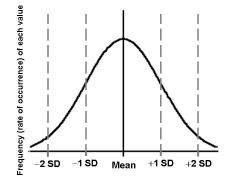
A smooth, "bell-shaped" curve and is symmetrical about the mean of the distribution.
|
|
|
What is the normal range of laboratory values?
|
The mean of the values +/- 2 standard deviations, this would include 95% of the values
|
|
|
What is the proportion of a data set?
|
The number of observations w/ a given characteristic divided by the total number of observations.
*i.e. (number of ppl w/ MI)/(total population) |
|
|
What is the ratio of a data set?
|
The number of observations in a given group w/ a given characteristic, divided by the number of observations w/o a given characteristc.
*i.e. (number of pts w/ MI)/(number of pts w/o MI) |
|
|
In a population of 100 men, 10 died of a myocardial infarction; What is the proportion of men in this population who died from a MI? What is the percentage of men who died from a MI? What is the ratio of men who died from a MI in this population?
|
proportion = .1
percentage = 10% ratio = .111 |
|
|
What is the rate?
|
the frequency or number of 'events' that occur in a defined time period.
|
|
|
What is the incidence rate?
|
the total number of *->NEW<-* cases over a specified period of time.
|
|
|
What is the prevalence rate?
|
The total number of cases of disease at a given point in time.
|
|
|
A post-menopausal woman presents to your office and you wonder if hormone replacement therapy (HRT) is beneficial in reducing coronary artery disease and specifically myocardial infarctions (MIs).
*Is this a background or foreground question? What is the question type? |
Foreground, Therapy
|
|
|
What is bias?
|
A systematic error at any stage of a study which produces results that are different from the truth.
|
|
|
What is systematic error?
|
Deviation from the truth which has direction.
|
|
|
What is random error?
|
Variation from the truth due to chance alone and why we do statistical testing.
|
|
|
Why do statistical testing?
|
To determine the probability that a result might be due to chance (random error)
|
|
|
What is the purpose of hypothesis testing?
|
To infer generalizations from a sample population from which it came.
|
|
|
What are the steps of hypothesis testing?
|
1. State the research hypothesis
2. Decide on the appropriate statistical test 3. Select the level of significance for the statistical test. 4. Perform the calculation 5. Draw and restate the conclusion |
|
|
What is the null hypothesis?
|
H0: there is NO DIFFERENCE b/e a new treatment and a placebo or b/e two variables or treatments for the study outcome.
*i.e. There is no difference b/e hormone replacement therapy versus placebo for the outcome of a MI |
|
|
What is the alternative hypothesis (H1)?
|
There IS A DIFFERENCE b/e the two variables or treatments for the study outcome.
|
|
|
What is the P value?
|
The probability that the observed result is due to chance alone.
|
|
|
What happens when p > .05?
|
We RETAIN the null hypothesis that there is NO DIFFERENCE b/e the two groups for the comparison made.
|
|
|
What happens when p < .05?
|
We REJECT the null hypothesis and accept the alternative hypothesis that there is a difference b/e the comparison made.
|
|
|
What is type I or "alpha" error?
|
Incorrectly rejecting the null hypothesis when it is actually true.
|
|
|
What is type II or "beta" error?
|
Accepting the null hypothesis when it is actually false.
|
|
|
What is the probability of making a beta error?
|
20%
|
|
|
What should you look for to avoid beta errors?
|
The power of a study
|
|
|
What is the power of a study?
|
The probability that a study will detect a clinically important difference
|
|
|
What is the most common reason for beta error?
|
Insufficient sample size
|
|
|
What is the Boolean operator "and"?
|
Articles that combine or overlap all linked phrases.
*i.e. Clinical trial [pt] AND hormone replacement therapy AND women's health initiative |
|
|
What is the Boolean operator "or"?
|
Yields all articles that have listed any of the articles
|
|
|
What is the Boolean operator "NOT"?
|
Excludes articles following the use of this term
|