![]()
![]()
![]()
Use LEFT and RIGHT arrow keys to navigate between flashcards;
Use UP and DOWN arrow keys to flip the card;
H to show hint;
A reads text to speech;
32 Cards in this Set
- Front
- Back
|
Demography |
Study of pop structure and growth Driven by 4p3 |
|
|
Demography variablea |
4p3, gender ratios, age ratio, Nc, Ne |
|
|
Age pyramid |
Females and males differ in when reproductive potential ends (fecundity) |
|
|
What is the standard method for looking at demographics? |
Life tables |
|
|
When were life tables introduce to ecology and by who |
1926 Raymond pearl |
|
|
Lifetables |
Age specific summary of N/M of a specific cohort |
|
|
Cohort |
Members of a population that are the same age |
|
|
How do we form cohorts? How many individuals make up a cohort |
Single gender, born/hatched same year 1,000 individuals |
|
|
LT - x, nx, lx, dx, qx |
x - Age class nx - Individuals alive in age class lx - Proportion of individuals suriving from start of table to next class dx - death during age class qx - per capita death rate |
|
|
lx and qx formulas |
lx = nx / no (no - original cohort number) qx = dx / nx |
|
|
Type I survivorship curve |
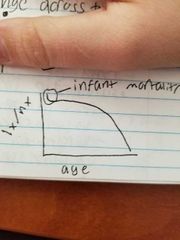
Lowish M across age groups until oldest Humans and # of other mamms |
|
|
Type II survivorship curve |
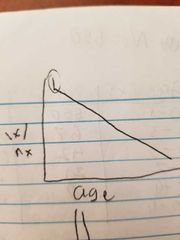
Constant death rate Birds, fish |
|
|
Type III survivorship curve |
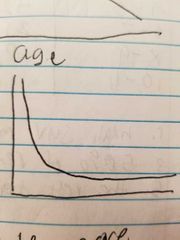
High M with young, low M for rest of life Fish, inverts, parasites |
|
|
3 types of data we can collect for LT |
Survivorship directly observed (follow cohort throughout life) Age at death Age structure directly observed |
|
|
3 types of LT |
Dynamic Static Dynamix composite |
|
|
Dynamic LT |
Cohort throughout life Lifetime monitoring |
|
|
Static LT |
Sample pop in real time (age, sex, etc) Build snapshot |
|
|
Dynamic composite LT |
Sample individuals across time (artificial cohort) Pool data over time |
|
|
Senescence |
Gradual deterioration of function with age |
|
|
What would a mortality curve look like? |
J shaped |
|
|
Intrinsic capacity for increasing numbers, we work at what level |
Population |
|
|
Pop lvl characteristics we look at |
Ave realized longevity Ave survival rate Ave N Ave growth rate |
|
|
What determines the averages? |
Resources |
|
|
Biotic vs abiotic resources |
Nutrient, predators, disease, parasites, symbiotes, competition Vs Environment (climate, weather, element availability) |
|
|
Organismal capacity for increasing will depend on what 3 things |
Fecundity/fertility Longevity Speed of development |
|
|
How to measure the capacity? (Formula) |
bx = # female offspring / # female in age group |
|
|
Total fertility rate (TFR) |
# of live births to an average female over reproductive life span |
|
|
Why is repro lifespan window increasing? |
Endocrine disruptors that mimic natural hormones |
|
|
Birth rate |
Birth per 1000 fem in age class |
|
|
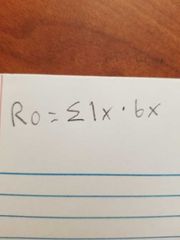
Net reproduction rate (Ro) |
Ave # of fem offspring produced by fem in lifetime |
|
|
Ro formula |
|
|
|
Ro values of >1, =1, <1 mean what |
Ro>1 means pop is growing Ro=1 means pop is stable Ro<1 means pop is shrinking |