Reading...
![]()
Play button
![]()
Play button
![]()
Use LEFT and RIGHT arrow keys to navigate between flashcards;
Use UP and DOWN arrow keys to flip the card;
H to show hint;
A reads text to speech;
24 Cards in this Set
- Front
- Back
|
What is the Volatile acid
|
Metabolically produced CO2+ H2O
CO2 is exhaled. Normally makes up ~99.8% of daily acid production. |
|
|
What are the Nonvolatile (fixed) acids
|
Sulfuric acid
Phosphoric acid Hydrochloric acid Organic acids not oxidized to CO2 + H2O: -Lactic acid -Acetoacetic acid -Beta-Hydroxybutyric acid |
|
|
Name the components of the mechanism which regulates H+ ion concentration in the blood and body fluids.
|
1. pH-sensitive receptors
2. CNS control centers 3. Lungs 4. Kidneys 5. Buffer systems |
|
|
Name the four major buffer systems present in the blood
|
A. Carbonic Acid-Bicarbonate Buffer System
B. Phosphate Buffer System – only supporting role C. Plasma Proteins D. Hemoglobin |
|
|
Define the term “Whole Blood Buffer Base”.
|
The sum of the concentrations of the anions of all blood buffers. It is the sum of all the potential H+ ion acceptors in whole blood. Stated another way, it is the sum of the bicarbonate and non-bicarbonate buffer anions in the blood.
|
|
|
what do changes in the magnitude of the Whole Blood Buffer Base signify with regard to the acid-base status of the blood.
|
It is an index of non-respiratory acid-base changes
|
|
|
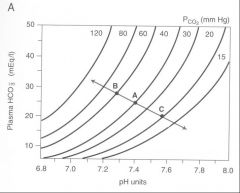
Sketch a pH bicarbonate diagram, and correctly label each axis.
|

pH on X bottom, bicarb on Y axis, pCO2 on X top
|
|
|
Sketch a pH bicarbonate diagram, and identify the blood buffer line. What is it's significance.
|
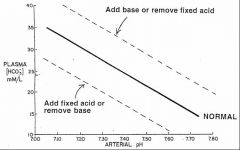
Show changes in arterial pH and plasma [HCO3-] when CO2 is added to the blood or removed from the blood.
|
|
|
Sketch a pH bicarbonate diagram, andidentify the PCO2 isobar.
|
Show changes in arterial pH and plasma
[HCO3-] when non-volatile acids are added to the blood or removed from the blood, at any constant PCO2 value. |
|
|
Sketch a pH bicarbonate diagram, and state the significance of the point of intersection of the two lines.
|
blood buffer lines indicate metabolic contribution to pH, pCO2 isobar indicates respiratory contribution. Intersection is the pH state the body is existing in.
|
|
|
Sketch a pH bicarbonate diagram, and state what determines the slope of the blood buffer line.
|
better buffering capacity of the blood (metabolic compensation) creates a steeper slope.
|
|
|
Sketch a pH bicarbonate diagram, and describe the conditions which will affect the positions of the blood buffer line and the PCO2 isobar.
|
1. Respiratory disturbances (ventilation) change the position of the PCO2 isobar.
2. Non-respiratory (metabolic) disturbances change the position of the blood buffer line. 3. Mixed disturbances change the positions of both the isobar and the blood buffer line. |
|
|
Base excess
|
a condition following addition of base to or removal of fixed acid from the blood.
blood buffer line moves upward |
|
|
Base deficit (usually reported as a negative value of base excess)
|
A condition following addition of fixed acid to or removal of base from the blood.
the blood buffer line movea downward |
|
|
What is the significance of base excess or base deficit?
|
another index of non-respiratory acid-base changes
reflects the magnitude of the change in the whole blood buffer base value in an acid-base disturbance, (not just the change in plasma HCO3- concentration) Quantitatively, base excess or deficit is the amount (mEq) of acid or base required to titrate the pH of a blood sample to 7.4, at a PCO2 of 40 mm Hg. Base excess or deficit is equivalent to the vertical distance between the normal blood buffer line and an abnormal blood buffer line. Normal value: 0 ± 2 mEq/liter |
|
|
Sketch a of pH-bicarbonate diagrams representing the directional changes from the normal values of PCO2, [HCO3-] and pH under conditions of un-compensated and compensated a) respiratory acidosis
|

start out at point A. Respiratory acidosis will move along blood buffer line in to the left to a point of lower pH(uncompensated). As metobolic compensation occurs we move up a pCO2 isobar to try and achieve a pH closer to physiologic nml (~7.4)
|
|
|
b) respiratory alkalosis
|
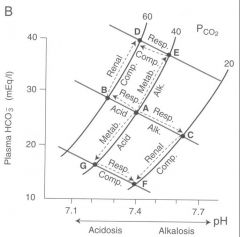
start out at point A. As ventilation increases and pCO2 goes down blood pH increases ( pt C). Metabolic compensation occurs by decreasing amount of HCO3- secreted) the result is an incomplete compensation towards physiologic pH downwards towards pt F.
|
|
|
Sketch a of pH-bicarbonate diagrams representing the directional changes from the normal values of PCO2, [HCO3-] and pH under conditions of un-compensated and compensated c) metabolic acidosis
|

Start out at point A. Met acidosis moves us down along the pH isobar towards point G. Ventilation increase of respiratory compensation moves us right along the blood buffer line towards point F (compensation is incomplete however)
|
|
|
Sketch a of pH-bicarbonate diagrams representing the directional changes from the normal values of PCO2, [HCO3-] and pH under conditions of un-compensated and compensated d) metabolic alkalosis
|

Start out at point A. Increae in base metabolically moves us upward on a pCO2 isobar towards point E(metabolic alkalosis). Respiratory compensation of decrease in vetilation brings us to the left along a blood buffer line back towards point D and physiologic pH (incomplete compensation however)
|
|
|
Anion Gap
|
Estimated as: [ Na+] - ( [ Cl -] + [ HCO3-] ).
Represents the difference between concentrations of unmeasured anions and unmeasured cations. I.e., [ UA ] – [ UC ]. Normal value: 12.4 ± 2 meq/l |
|
|
Anion Gap is Increased By:
|
Decreases in unmeasured cations (UC): hypokalemia, hypocalcemia, hypomagnesemia.
Increases in unmeasured anions (UA, most common cause): -Organic anions: e.g. lactate, ketone acids -Inorganic anions: phosphate, sulfate -Proteins -Exogenous anions: e.g., salicylate, penicillin -Lab errors in measuring [ Na+ ] [ Cl - ] or [ HCO3- ]. |
|
|
Anion Gap is Decreased By:
|
Increases in unmeasured cations (UC):
-Hyperkalemia, hypercalcemia, hypermagnesemia -Abnormal cation retention: e.g., lithium Decreases in unmeasured anions (UA, most common cause): hypoalbuminemia Lab errors |
|
|
Metabolic Acidosis With Increased Anion Gap (Serum [ Cl -] is normal):
|
1.Ethylene glycol ingestion
2.Lactic acidosis 3.Methanol ingestion 4.Paraldehyde ingestion 5.Aspirin ingestion 6.Renal failure (uremic acidosis) 7.Ketoacidosis |
|
|
Metabolic Acidosis With Normal Anion Gap (Serum [ Cl -] is elevated in absolute terms, or relative to the Na+ concentration)
|
1.Dilutional acidosis: increased extracellular volume by infusion of isotonic NaCl solution.
2.Gain of Cl-containing acids: e.g., HCl, NH4Cl 3.Loss of bicarbonate 4.Gain of acids with non-chloride anions which are rapidly excreted by the kidneys. |