![]()
![]()
![]()
Use LEFT and RIGHT arrow keys to navigate between flashcards;
Use UP and DOWN arrow keys to flip the card;
H to show hint;
A reads text to speech;
21 Cards in this Set
- Front
- Back
|
Measure of central tendency |
a single value that can be used to represent all the other values in the collection |
|
|
Center |
this measure tells us where the ________ of the distribution lies |
|
|
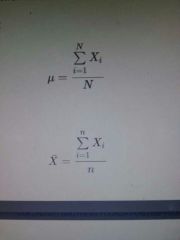
Arithmetic mean |
sum of all the values in the collection divided by the total number of elements in the collection |
|
|
population/sample mean |
|
|
outlier |
data values that are markedly different from the rest of the data items |
|
|
Center of mass |
the mean is |
|
|
Interval scale |
data values should be measured using at least an |
|
|
Zero |
the first central moment about the mean is |
|
|
Median |
divides the array into two equal parts |
|
|
Mode |
the observed value that occurs witb the greatest frequency in a data set |
|
|
Measure of locatiob |
provide information on the percentage of observations in the collection whose values are less than or equal to it |
|
|
Percentiles |
divide the ordered observations into 100 equal parts |
|
|
Measure of Dispersion |
help us characterize the data set in terms of how varied the observations are fron each other |
|
|
Reliable |
if we take a random observation from the collection, its value will be close to the mean or to the median |
|
|
Measure of absolute dispersion |
have the same unit as the unit of the observations |
|
|
measure of relative dispersion |
have no unit; can be used in comparing the variability of one distribution with another distribution |
|
|
Range |
distance between the maximum value and the minimum value |
|
|
Interquartile range |
distance between the third and first quartiles of a data set |
|
|
Bienayme-Chebyshev Rule |
approx. range of data |
|
|
z-score |
also called "standard score" |
|
|
measure of skewness |
a single value that indicates the degree and direction of asymmetry of a distribution |