![]()
![]()
![]()
Use LEFT and RIGHT arrow keys to navigate between flashcards;
Use UP and DOWN arrow keys to flip the card;
H to show hint;
A reads text to speech;
34 Cards in this Set
- Front
- Back
|
Project Quality Mgmt knowledge area |
includes the processes and activities of the performing organization that determine quality policies, objectives, and responsibilities so that the project will satisfy the needs for which it was undertaken. |
|
|
Plan Quality Mgmt process |
ID's quality requirements and/or standards for the project and its deliverables and documenting how the project will demonstrate compliance with quality requirements and/or standards. |
|
|
Quality as per ISO 9000 [10] |
the degree to which a set of inherent characteristics fulfill requirements. |
|
|
Aspects important to Quality |
1. Customer Satisfaction 2. Prevention over Inspection 3. Continuous Improvement 4. Mgmt Responsibility 5. COQ |
|
|
Continuous Improvement methods |
1. Plan-Do-Check-Act (PDCA) cycle 2. Total Quality Mgmt (TQM) 3. Six Sigma 4. Lean Six Sigma |
|
|
Commonly used process improvement models |
1. Malcolm Bridge 2. Organizational PM Maturity Model (OPM3) 3. Capability Maturity Model Integration (CMMI) |
|
|
Cost of Quality (COQ) |
refers to the total cost of the conformance work and the non-conformance work that should be done as a compensatory effort. |
|
|
COQ: Cost of Conformance categories |
1. Prevention Cost 2. Appraisal Cost |
|
|
COG: Cost of Conformance: Appraisal Costs |
1. Testing 2. Destructive testing loss 3. Inspections |
|
|
COG: Cost of Conformance: Prevention Cost |
1. Training 2. Document Processes 3. Equipment 4. Time to do it Right |
|
|
COG: Cost of Non-conformance |
1. Internal Failure 2. External Failure |
|
|
COG: Cost of Non-conformance: Internal |
1. Rework 2. Scrap |
|
|
COG: Cost of Non-conformance: External |
1. Liabilities 2. Warranty Work 3. Lost Business |
|
|
Plan Quality Mgmt process inputs |
1. PM Plan 2. Stakeholder Register 3. Risk Register 4. Requirements Documentation 5. EEF 6. OPA |
|
|
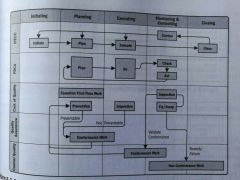
Relationships between QA and CQ to the COQ, PDCA, and IPECC models and PM process groups |
|
|
|
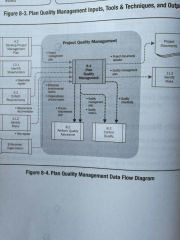
Plan Quality Mgmt Data Flow Diagram |
|
|
|
What aspects of the PM Plan act as inputs for the Plan Quality Mgmt process? |
1. Scope Baseline 2. Schedule Baseline 3. Cost Baseline 4. Other Plans |
|
|
Plan Quality Mgmt process T&T's |
1. Cost-Benefit Analysis (CBA) 2. COQ 3. Seven Basic Quality Tools 4. Benchmarking 5. Design of Experiments 6. Statistical Sampling 7. Additional Quality Planning Tools 8. Meetings |
|
|
Seven Basic Quality Tools |
1. Cause-and-Effect diagrams (fishbones) 2. Flowcharts 3. Checksheets 4. Pareto diagrams 5. Histograms 6. Control Charts 7. Scatter diagrams |
|
|
Fishbone diagram |
problem is placed at the head and traces the problem back to the root cause. Often proves useful in linking undesirable effects seen as special variation. |
|
|
Checksheets |
are used to organize facts in a manner that will facilitate the effective collection of useful data about a potential quality problem. Especially useful for gathering attributes data while performing inspections to ID defects. |
|
|
Pareto diagrams |
Vertical bar charts used to ID the vital few sources that are responsible for causing most of a problem's effects. |
|
|
Histograms |
bar charts that describe the central tendency, dispersion, and shape of a statistical distribution. Does NOT factor time. |
|
|
Control Charts |
determines if a process is stable or has a predictable performance. An upper and lower control limit is set and the process must perform within that range. |
|
|
When evaluating a process via a control chart when is a process determined to be out of control? |
1. A data point exceeds a control limit 2. Seven consecutive plot points above or below the mean |
|
|
Design of Experiments (DOE) |
is a statistical method for IDing which factors may influence specific variables of a product or process under development or production. May be used during Plan Quality Mgmt process to determine the # and type of tests and their impact on COQ. |
|
|
DOE also |
plays a role in optimizing products or processes |
|
|
Additional Quality Planning Tools are |
1. Brainstorming 2. Force Field Analysis 3. Nominal Group Technique 4. Quality Mgmt and Control Tools (discussed in 8.2) |
|
|
Plan Quality Mgmt process outputs |
1. Quality Mgmt Plan 2. Process Improvement Plan 3. Quality Metrics 4. Quality Checklists 5. Project Document Updates |
|
|
Quality Mgmt Plan |
a component of the PM Plan that describes how the organization's quality policies will be implemented. |
|
|
Process Improvement Plan |
a subsidiary of the PM Plan that details the steps for analyzing PM and product development processes to identify activities that enhance their value. |
|
|
Areas to consider in the Process Improvement Plan |
1. Process Boundaries 2. Process Configuration 3. Process Metrics 4. Targets for Improved Performance |
|
|
Examples of Quality Metrics |
1. On-Time Performance 2. Cost Control 3. Defect Frequency 4. Failure Rate 5. Availability 6. Reliability 7. Test Coverage |
|
|
Quality Mgmt Plan generally contains |
Section A: Quality Control 1. Major Deliverable to be Tested 2. Standards and Criteria 3. Monitoring and Controlling 4. Quality Control Schedule Section B: Quality Assurance 1. Processes subject to QA 2. Standards and Stakeholder Expectations 3. QA Activities 4. QA Schedule Section C: Continuous Process Improvement |