Reading...
![]()
Play button
![]()
Play button
![]()
Use LEFT and RIGHT arrow keys to navigate between flashcards;
Use UP and DOWN arrow keys to flip the card;
H to show hint;
A reads text to speech;
66 Cards in this Set
- Front
- Back
|
Case Control study
- compares what groups? - asks "what......?" |
- with DISEASE vs. without DISEASE
- "What HAPPENED?" |
|
|
Case Control study
- measures what? |
- Odds Ratio (OR)
|
|
|
Cohort study
- compares what groups? - asks "what ......?" |
- w/ RISK FACTOR vs. w/o RISK FACTOR
- "What WILL HAPPEN?" |
|
|
Cohort study
- measures what? |
- Relative Risk (RR)
|
|
|
Cross Sectional Study
- asks "what .......?" |
- "What ...IS HAPPENING?"
|
|
|
Cross Sectional Study
- measures what? |
Disease Prevalence
(Dz freq. & related risk factors) |
|
|
Cross Sectional study
- can show what? - but does NOT show what? |
- Risk Factor association with Dz
- does NOT Establish Causality |
|
|
Twin Concordance Study
- compares what data? - compares btw what groups? |
- Frequency of Dz (prevalence)
- monozygotic twins & dizygotic twins |
|
|
Adoption Study
- compares what data? - compares btw what groups? |
- Frequency of Dz (prevalence)
- Siblings raised by biologic vs. adoptive parents |
|
|
Twin Concordance study measures?
Adoption study measures? |
- Heritability
- Heritability & Environmental Factors |
|
|
Clinical Trials Phase I
- Sample size - Type of patients - Purpose |
- Small number of patients
- Healthy volunteers - Pharmacokinetics (safety & toxicity) |
|
|
Clinical Trials Phase II
- Sample size - Type of patients - Purpose |
- Small number of patients
- Pts with Disease of interest - Pharmacodynamics (efficacy & dosing & side effects) |
|
|
Clinical Trials Phase III
- Sample size - Type of patients - Purpose |
- Large number of patients
- Pts with Disease of interest randomly assigned to either New Tx or to best available Tx (or placebo) - Compares new Tx to current standard of care |
|
|
Highest echelon of clinical evidence occurs with what type of study?
How is this study performed? |
Meta-Analysis
- pools data from several studies to achieve overall conclusion |
|
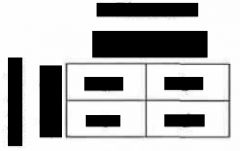
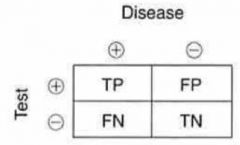
Sensitivity & Specificity Table
|

Sensitivity & Specificity Table
|
|
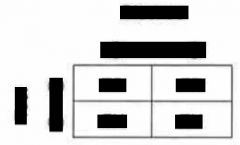
Ratio Calculation Table
|

Ratio Calculation Table
|
|
Hypothesis Table
|
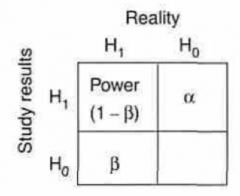
Hypothesis Table
|
|

Sensitivity = ?
|
= TP / (TP + FN)
|
|

Specificity = ?
|
= TN / (TN + FP)
|
|
|
Sensitivity --> 1 is desirable to rule _____ disease?
Specificity --> 1 is desirable to rule _____ disease? |
- Out
(indicates low FP rate) - In (indicates low FN rate) |
|
|
Sensitivity = 1 - ?
Specificity = 1 - ? |
- False Negative rate
- False Positive rate |
|
|
If 100% sensitivity, then all negatives must be?
|
- True Negatives
(FN = 0) |
|
|
If 100% specificity, then all positives must be?
|
- True Positives
(FP = 0) |
|
|
Sensitivity is used as a screening tool in what type of diseases?
|
- diseases with Low Prevalence
|
|
Positive Predictive Value (PPV) = ?
|
= TP / (TP + FP)
|
|

Negative Predictive Value (NPV) = ?
|
= TN / (TN + FN)
|
|
|
Sensitivity measures _______ of people who ______.
PPV measures _______ of test results that are ______. |
- Proportion
- Test Positive - Probability - TP |
|
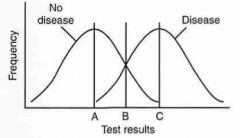
A, B, & C indicates?
|
A = 100% sensitive
B = Most ACCURATE C = 100% specific |
|
|
Under what conditions would a High Sensitivity or Specificity provide a Low PPV?
|
- if the Prevalence is Low
|
|

Odds ratio = ?
|
= (a/d) / (b/c)
(or .... = ac / bd) |
|
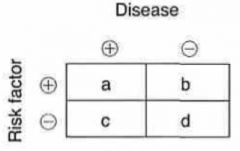
Relative risk = ?
|
= [a / (a+b)] / [c / (c+d)]
|
|

Attributable risk = ?
|
= [a / (a+b)] - [c / (c+d)]
|
|

H0 is what?
H1 is what? |
- Null hypothesis
- Alternate hypothesis |
|

Null hypothesis implies what association?
|
No association btw Dz & Risk factor
|
|

Alternate Hypothesis (H1) implies what association?
|
- Association exists btw Dz & Risk Factor
|
|

Alpha & Beta is what type of error?
|
Type I error
Type II error |
|
|
Type I error (Alpha) occurs when a study shows what?
|
Effect (or difference) Exists
when in reality None Exists ("convicting an innocent man") |
|
|
Type II error (Beta) occurs when a study shows what?
|
No Effect (or difference) Exists
when in reality, it Exists ("setting a guilty man free") |
|
|
In assessing errors, what is ... p?
|
- probability of making a Type I error
|
|
|
In assessing errors, what does it mean when p < 0.05?
|
- less than 5% chance that
data will show something that is NOT really there |
|
|
Mistakingly accepting Experimental hypothesis (H1), while rejecting Null hypothesis (H0) is called?
|
- Type I error
|
|
|
Mistakingly accepting Null Hypothesis (H0), when in reality the Experimental Hypothesis (H1) is false is called?
|
- Type II error
|
|
|
Power is defined as the probability of?
|
- rejecting Null hypothesis (H0)
when it is false (likelihood of finding a difference that exists) |
|
|
Equation
- Power = ? |
= 1 - B
|
|
|
Percentage within
- 1 standard deviation - 2 standard deviation - 3 standard deviation |
- 68.0 %
- 95.0 % - 99.7 % |
|
|
Equation
- Standard Error of Mean (SEM) = |
= SD / (sqrt of n)
(SD = Standard Deviation) (n = sample size) |
|
|
As SAMPLE SIZE (n) increases,
- Standard Error of Mean (SEM) will? - compare SEM to SD |
- decrease
- less than SD |
|
|
CONFIDENCE INTERVAL (CI)
- is the range btw? |
[mean - Z(SEM)]
to [mean + Z(SEM)] |
|
|
95% Confidence Interval implies what:
- p value? - Z value? |
p = 0.05
Z = 1.96 |
|
|
Define ........ t - test
|
Difference btw the MEANS of 2 groups
("Mr. T is Mean") |
|
|
Define ....... ANOVA test
|
Difference btw the MEANS of 3+ groups
(ANalysis Of VAriance of 3+ variables) |
|
|
Chi-Squared (X^2)
- compares? |
2 or more proportions (or percentages)
(or categorical outcomes, not means) |
|
|
Correlation Coefficient (r)
- if value is closer to 1, it implies what? |
- stronger correlation btw 2 variables
|
|
|
Equation
- Coefficient of Determination = ? |
= r^2
|
|
|
BMI
- equation |
= [(weight in kg) / (height in meters)^2]
|
|
|
BMI
- normal values - obese values - morbidly obese values |
Normal: 18.5 to 24.9
Obese: > 30.0 Morbidly Obese: > 40.0 |
|
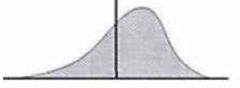
Type of Skew & Implies what?
|
Positive Skew
(Positively RIGHT on the Tail) Mean > Median > Mode |
|
Type of Skew & Implies what?
|
Negative Skew
Mean < Median < Mode (Left Tail...Means Less) |
|
|
What variable is affected LEAST by Outliers?
|
- Mode
|
|
|
Random Error
- implies test study has REDUCED value of what? |
(REP SAV)
- Reduced PRECISION |
|
|
Systemic Error
- implies test study has REDUCED value of what? |
(REP SAV)
- Reduced ACCURACY |
|
|
Precision implies what occurence in test measurements?
Precision implies the absence of what in test measurements? |
- Consistency & Reproducibility
(Reliability) - Random Variation |
|
|
Accuracy implies what occurence in test measurements?
|
- Trueness
(Validity) |
|
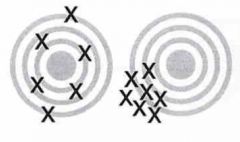
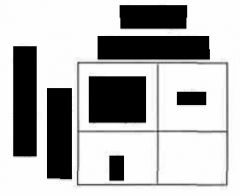
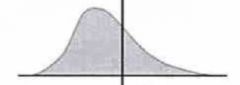
Picture depicts what?
|
Left = Accuracy (reliability)
Right = Precision (validity) |
|
|
H0 is NOT rejected, if the 95% CI for:
- MEAN difference btw 2 variables ..... |
- includes 0
|
|
|
H0 is NOT rejected, if the 95% CI for:
- OR or RR ........ |
- includes 1
|