![]()
![]()
![]()
Use LEFT and RIGHT arrow keys to navigate between flashcards;
Use UP and DOWN arrow keys to flip the card;
H to show hint;
A reads text to speech;
68 Cards in this Set
- Front
- Back
|
What is the definition of an incidence rate? |
The incidence rate of a disease is defined as the number of new cases of a disease that occur during a specified period of time in a population at risk for developing the disease. Incidence rate = new cases / no. of persons at risk (usually x 1000 to make it per 1000 people) per unit time |
|
|
What are the only people who can be included in the denominator in the incidence expression? |
People at risk for developing the disease. Incidience of uterine cancer can't include men. |
|
|
What do we use for the denominator in calculating the incidence rate? |
The denominator used for the calculation of incidenceis the sum of all the disease-free person-time periods during the period ofobservation of the population at risk. Person years! |
|
|
What is cumulative incidence? What else do we call it? |
Cumulative incidence is a simpler measure of the occurrence of a disease or healthstatus. Unlike incidence, it measures the denominator only at the beginning of astudy. Cumulative Incidence = Number of people who get disease in specified period / number of ppl at risk at beginning of period (x 10^n) Sometimes called incidence proportion. |
|
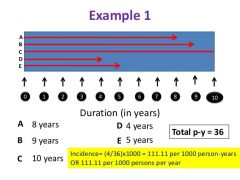
Calculate the incidence rate and the cumulative incidence rate! |
Incidence = 4/36 person years = 0.111 per person-year (can multiply by 1000) Cumulative incidence = 4/10 = 40% during 10 years (can multiply by 1000) |
|
|
What is the definition of prevalence? How do we calculate it? |
Prevalence is the proportion of people with the disease at a given time. P = number of people with disease at specified time/ population at risk (x10^n) |
|
|
What is the point prevalence rate and the period prevalence rate? |
Point prevalence rate = prevalence when data is collected at one point in time. Period prevalence rate = prevalence when data is collected over an interval of time. = total number of cases at any time during interval, divided by pop-at-risk midway throuhgout the interval. |
|
|
Give three factors that increase prevalence in a population. |
1. The severity of the illness (if more people die, prevalence is less) 2. The duration of illness (obvious) 3. The incidence of a disease (more ppl getting sick means more prevalence) |
|
|
What is the relationship between incidence and prevalence and duration? What assumption are we making here? |
P = I x D Assume steady state population of disease (constant prevalence) and duration of disease the same for all. |
|
|
What is the difference between mortality and morbidity? |
Morbidity refers to an incidence of ill health in a population. Mortality refers to the incidence of death or the number of deaths in a population |
|
|
What is risk difference (absolute risk)? |
The risk difference, also called excess risk, is the difference in incidence rates between exposed and unexposed groups in the population. It is a useful measure ofthe extent of the public health problem caused by the exposure |
|
|
What is the attributable fraction (AF)? |
It is the proportion of all cases that can be attributed to a particular exposure. = (risk difference between exp/not exposed) / incidence among exposed |
|
|
What is the relative risk? What is it also called? |
The relative risk (also called the RISK RATIO) is the ratio of the risk of occurrence (incidence) ofa disease among exposed people to that among the unexposed |
|
|
What is the interpretation of a relative risk of 3.30 for smokers vs non-smokers getting lung cancer? |
Risk of the lung cancer in smokers is increased 230% relative to the non-smokers
|
|
|
What is attributable risk (AR)? |
Attributable risk is the rate of a disease or other outcome in exposedindividuals that can be attributed to the exposure. How much risk of cancer occurs BECAUSE of the exposure ... after all, there will still be cancer if we eliminate benzene. = I(exp) - I(unexp) (often x 100) |
|
|
If there were 6 deaths per 100 among smokers, and 1 deathper 100 in non-smokers, what would the AR be? |
5 per 100 person |
|
|
What is an observational study? |
Observational studies allow nature to take its course: the investigator measures butdoes not intervene (not an experimental study) |
|
|
What is a cross-sectional study? when does it provide useful information about cause-and-effect? |
a type of observational study that analyzes data collected from a population, or a representative subset, at a specific point in time—that is, cross-sectional data. If the exposure data are known to representexposure before any effect occurred, the data from a cross-sectional study can betreated like data generated from a cohort study |
|
|
What is a longitudinal study? |
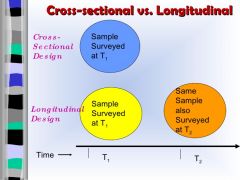
A longitudinal study is an observational research method in which data is gathered for the same subjects repeatedly over a period of time |
|
|
What is a case control study? |
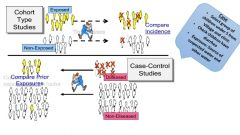
A study that compares patients who have a disease or outcome of interest (cases) with patients who do not have the disease or outcome (controls), and looks back RETROSPECTIVELY to compare how frequently the exposure to a risk factor is present in each group to determine the relationship between the risk factor and the disease. |
|
|
What measure do we have to quantify the association between exposure and disease in a case-control study? |
We use the Odds ratio, for case-control. |
|
|
What is the probability of rolling a 6, and what are the odds of rolling a 6? |
Pr(6) = 1/6 (ratio of events to total events) O(6) = 1/5 (ratio of events to non events) |
|
|
How do we calculate an odds ratio for a case-control study? |
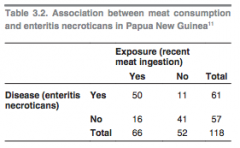
We take the ratio of the odds of exposure among cases to the odds of exposure among controls. OR = (50/11) / (16/41) = 11.6 |
|
|
How would you interpret an OR of 11.6 in words? |
The odds of finding an exposure is 11.6 x higher in the diseased group compared with the control group. |
|
|
What is a cohort study? |

Cohort studies, also called follow-up or incidence studies, begin with a group ofpeople who are free of disease, and who are classified into subgroups according toexposure to a potential cause of disease or outcome. Variables of interestare specified and measured and the whole cohort is followed up to see how thesubsequent development of new cases of the disease (or other outcome) differsbetween the groups with and without exposure |
|
|
Are cohort studies prospective or retrospective studies? |
DEPENDS. The term “prospective”refers to the timing of data collection and not to the relationship between exposureand effect. Thus there can be both prospective and retrospective cohort studies |
|
|
Give one advantage and 2 disadvantage of a cohort study. |
Advantage: Since cohort studies take healthy people as their starting-point,it is possible to examine a range of outcomes(in contrast to what can be achieved in case-control studies Disadvantage: expensive You'll be waiting forever for rare diseases to occur. |
|
|
What measure do we use to quantify exposure/disease association in cohort studies? |
Risk ratio (relative risk) |
|
|
Name three experimental types of study design in epidemiology |
Randomized control trial Field trial Community trial |
|
|
What is a randomized control trial? |
A randomized controlled trial is an epidemiological experiment designed to study theeffects of a particular intervention, usually a treatment for a specific disease (clinicaltrial). Subjects in the study population are randomly allocated to intervention andcontrol groups, and the results are assessed by comparing outcomes.To ensure that the groups being compared are equivalent, patients are allocatedto them randomly, i.e. by chance. If the initial selection and randomization is doneproperly, the control and treatment groups will be comparable at the start of theinvestigation; any differences between groups are chance occurrences unaffected bythe conscious or unconscious biases of the investigators. |
|
|
What are the two possible sources of error when measuring a result? |
Random error and systematic error |
|
|
What are the three major sources of sampling error in epidemiology? |
Sampling error ( a small sample is not representative of the population) Individual biological variation (not everyone will develop cancer at the same rate or have the same propensity for disease ... we can't control for every biological difference) |
|
|
What is another name for systematic error? |
Bias |
|
|
A study with small systematic error is said to have _______? |
High accuracy |
|
|
What are the two major types of bias in epidemiology? |
Selection bias Measurement bias |
|
|
What is selection bias? |
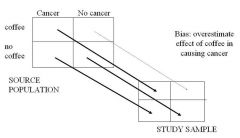
Selection bias occurs when there is a systematic difference between the characteristicsof the people selected for a study and the characteristics of those who are not. |
|
|
Give two examples of selection bias occuring in epidemiological studies. |
1. Anobvious source of selection bias occurs when participants select themselves for astudy, either because they are unwell or because they are particularly worried aboutan exposure = misleading result 2. An important selection bias is introduced when the disease or factor underinvestigation itself makes people unavailable for study (extreme: people exposed to formaldehyde leave the workplace under study) = misleading result |
|
|
What are two important measurement biases in epidemiology? |
1. Recall bias: cases may be more likely to recallpast exposure, especially if it is widely known to be associated with the disease understudy – for example, lack of exercise and heart disease 2. Observer bias: If the investigator, laboratory technician or the participant knows the exposurestatus, this knowledge can influence measurements and cause observer bias. We fight this using double-blind trials. |
|
|
What is a double-blind trial? |
A double-blind study means that neither the investigators, nor the participants, knowhow the latter are classified. |
|
|
What is confounding? |
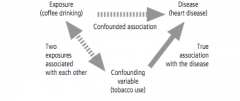
Confounding is a situation where another exposure exists in the study populationthat is associated both with the disease and the exposure being studied. |
|
|
What are the two criteria for a variable to be a confounder? |
For a variable to be a confounder, it must, in its ownright, 1. be a determinant of the occurrence of disease (i.e.a risk factor) and 2. be associated with the exposure underinvestigation. Thus, in a study of radon exposure andlung cancer, smoking is not a confounder if the smokinghabits are identical in the radon-exposed and controlgroups (because it's not associated with the exposure) |
|
|
What is the difference between bias and confounding? |
Bias creates an associationthat is not true, but confounding describes an association that is true, butpotentially misleading. |
|
|
What are the ways we control for confounders at the design stage (3) and at the analysis stage (2)? |
Design: Randomization Restriction Matching. Analysis: Stratification Statistical modeling |
|
|
Give one sentence describing all three ways to control confounders at the design stage: |
Randomization: Randomizing between controls and treatments means that the confounder will be present in both groups to the same degree. Restriction: Don't include people in the study who exhibit the confounder (don't let smokers into a study linking coffee to heart disease) Matching: Matching cases with controls to ensure that potential confounders are evenly distributed in each group. |
|
|
Give one sentence describing the two ways to control confounders at the design stage: |
Stratification: measurement of the strength of associations in welldefined and homogeneous categories (strata) of a potentially confounding variable. e.g. if sex is a confounder, the association is measured separately in men and women Statistical modelling: high-tech way of controlling for many confounding variables. |
|
|
What is the difference between validity and reliability? |
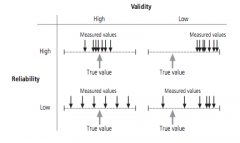
Validity = extent to which the study gets the right answer Reliability = extent to which study produces the same response each time. |
|
|
What are the different phases of clinical trials (phases 0-IV? |
Phase 0: First-in-human trials that give subtherapeutic dosages to determine the kinetics and dynamics of the drug Phase I: Testing within small group (20-80) to evaluate safety and identify side effects in healthy patients Phase II: Testing with a larger group (100-300) to determine efficacy (usually against a placebo) and of course we continue to monitor safety/side effects --> in people with the disease Phase III: Full-blown randomized clinical trial to compare drug with placebo or gold standard. Strict inclusion/exclusion criteria. Phase IV: Postmarketing studies after release and are ongoing during the drug's lifetime of medical use --> non-randomized |
|
|
Give two reasons why we use randomization in control trials? |
1. To avoid 'allocation bias' If clinician chooses more overweight people to get the treatment, they will lose more weight. Makes drug seem more effective 2. Randomization controls for confounders Treatment and control will have same level of confounders(e.g. controls and treatments should, in theory, have equal numbers of smokers) |
|
|
Why is randomized control trial so good at controlling for confounders? |
It controls for the confounders that we don't even KNOW about. |
|
|
What does a p-vale of 0.01 mean?? |
There is a 1 percent chance that the difference between groups is due to random sampling error. |
|
|
What is the difference in concern of the measures relative risk and hazard ratio? |
Relative risk is concerned with comparing the incidence of two groups at the end of a study. Hazard ratio is concerned with time-to-event |
|
|
How do we define 'hazard'? |
The probability that an individual at time t has an event at that time (assuming they've had no events up until time t) It's a time-dependent probability function. |
|
|
What is a hazard ratio? |
HR = hazard in treatment arm/hazard in control arm |
|
|
how would you interpret a HR = 1 and an HR =2 and a HR of 0.5? |
HR =1, event rates are the same in both groups HR = 2 (at any time, twice as many patients in the treatment group are having an event) HR=0.5, at any time, half as many patients in the treatment group are having an event. measure of instantaneous probability |
|
|
How do we distinguish between causation and association in epidemiology? |
Association is any statistical relationship, whether causal or not, between two random variables or bivariate data. Correlation is the same as association, but tends to refer to linear relationships Causation indicates that one event is the result of the occurrence of the other event; i.e. there is a causal relationship between the two events. |
|
|
What three things could explain an association between two variables that are NOT in reality related by a causal relationship? |
1. Chance (random error) 2. Bias (systemic error) 3. Confounders |
|
|
Why is it often tricky to establish a causal relationship in epidemiology? |
Many of studies are observational, rather than experimentaly |
|
|
What is a systematic review? (3) |
(1)A systematic review is a response to a clearly formulated research question (2)Ideally, it synthesis the data collected in ALL relevant primary studies that address the question. (3) In some cases, the results can be combined in a process called meta-analaysis |
|
|
What is publication bias? |
The phenomenon by which studies with positive/significant results are more ikely to be published than those with non-significant results. |
|
|
What is a meta-analysis? |
Meta-analysis is a powerful technique that allows the results of a number of differentstudies to be combined |
|
|
In a meta-analysis, simply, how do we obtain an average result from all the different studies? |
1. Each study is assigned a weight based on the amount of information it provides (inverse of standard error of OR) and the size of the study 2. A weighted average of the indiivdual study results is calculated. |
|
|
What is a key assumption underlying the use of a meta-analysis? |
All of the studies are estimating the same underlying effect and any variation between their results is due to chance. i.e. we assume that there is no statistical heterogeneity. |
|
|
What are the PICOT parameters for formulating a research question in a systematic review? |
P = population assessed I = intervention administered C = comparator (compared to what?) O = outcome (what result is being monitored) T = Timeframe |
|
|
What is a forest plot? |
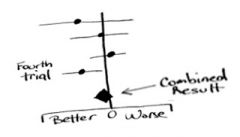
A forest plot, also known as a blobbogram, is a graphical display of estimated results from a number of scientific studies addressing the same question, along with the overall results. |
|
|
What does the vertical line in a forest plot represent? |
The vertical lineindicates the point where there is ‘no effect’, i.e. an odds ratio of 1.0 |
|
|
What does it mean when the 95% confidence interval crosses over the OR=1.0 vertical line in a forest plot? |
That means the result is not statistically significant (i.e. p > 0.05) |
|
|
What is heterogeneity? |
Heterogeneity = the extent to which the differences between the studies can be explained by factors other than chance. |
|
|
When is it not appropriate to pool results in a systematic review for meta-analysis? |
If there is statistical heterogeneity. |