![]()
![]()
![]()
Use LEFT and RIGHT arrow keys to navigate between flashcards;
Use UP and DOWN arrow keys to flip the card;
H to show hint;
A reads text to speech;
6 Cards in this Set
- Front
- Back
|
What is raw data? |
The listing of all the values (in the data set). |
|
|
What should we do if data too big to view in its raw form? |
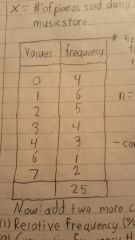
Use a Frequency Table as shown here: |
|
|
What do relative/cumulative frequencies show? |
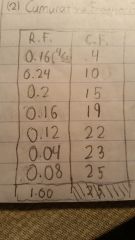
Relative frequencies show that values frequency relative to other values, while Cumulative Frequencies add the frequencies up to that value. Example table is shown here: |
|
|
What two types of frequency tables are there? What are the differences? |
The two types of frequency tables are: case 1 and case 2. The difference is that case 1 for many repeating values, while case 2 is for lack of repeating values (we group them in intervals instead). |
|
|
What are two ways we can graphically represent our data? |
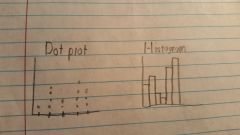
Dot Plot (Which is nice and effective until large data is involved), and Histograms which work better with larger data. Here's what they look like: |
|
|
What are six things we look for in visually examining data? why do look at each one? |
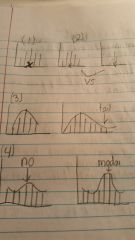
(1) Center -> Indicates standard/average value (2) Spread ->Indicates variability/diversity (3) Symmetry vs Skewness (4) Presence of extreme values/outliers -> these can "throw off" future calculations (5) Mode ->Most frequent value (must be frequent by significant amount) ->Bi-modal vs Uni-modal (6) Specific Shapes ->Bell-curve, J-curve, Triangle, Convex, etc. |