![]()
![]()
![]()
Use LEFT and RIGHT arrow keys to navigate between flashcards;
Use UP and DOWN arrow keys to flip the card;
H to show hint;
A reads text to speech;
16 Cards in this Set
- Front
- Back
|
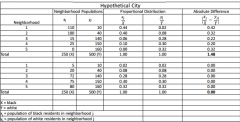
Index of dissimilarity (D) |
This is a measure of distribution, or evenness. If a group is not segregated, it's population is distributed evenly across all neighborhoods. D- empirical methodology for measuring the degree of all neighborhoods |
|
|
Index of dissimilarity example |
|
|
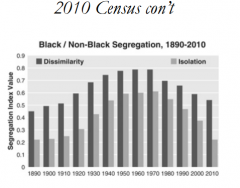
2010 Census _ African Americans experience the most racial segregation Then Hispanics Asians experience the least segregation |
|
|
Hypersegregation- Massey & Denton (1988) |
5 Measures of segregation: Evenness, Exposure, centralization, clustering, concentration *** Study looks at places where ethnic groups have 4 out of 5 of these |
|
|
evenness |
similarity of groups across neighborhoods (index of dissimilarity) |
|
|
Exposure/ Isolation |
captures the typical composition of neighborhoods where members live
(index of isolation) |
|
|
Centralization |
degree to which group members live close to the center of the city, relative to other groups |
|
|
Clustering |
degree to which group members live in neighborhoods that are close together within the city |
|
|
Concentration |
describes the extent to which a group lives in a restricted amount of space |
|
|
Massey and Denton Hyper-segregation Findings |
1980-2000 Mainly blacks experienced the hyper segregation after 2000 hyper-segregation decreased |
|
|
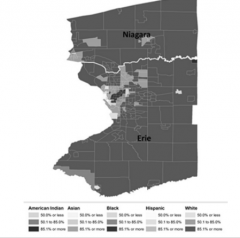
Segregated Buffalo, 6th most segregated city in america |
|
|
What causes segregation |
Economics- difference in income discrimination- especially in the housing market preferences- 2 arguments (1. minorities self-segregate) (2.whites disapprove of any minority) |
|

|
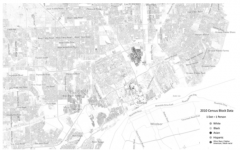
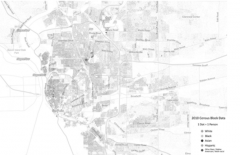
Racial Dot map |
|
|
Racial Dot map |
|
|
Racial Dot map |
|
|
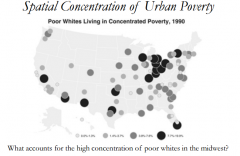
How poverty is concentrated in different areas around the country |