Reading...
![]()
Play button
![]()
Play button
![]()
Use LEFT and RIGHT arrow keys to navigate between flashcards;
Use UP and DOWN arrow keys to flip the card;
H to show hint;
A reads text to speech;
17 Cards in this Set
- Front
- Back
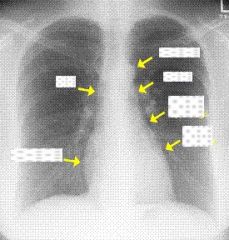
1q identify
|
1a identified
|
|

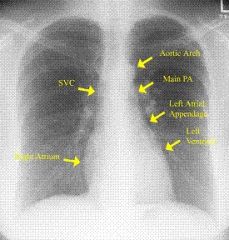
2q what technique is identified here
|
Central vascular volume is best estimated by comparing size of the vascular pedicle (superior vena cava (SVC) and aorta) on sequential studies. (A 0.5 cm change is about a 1 L change in the central vascular volume)
|
|

3q what is indicated by arrows?
|
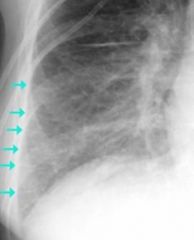
Increased fluid in pulmonary interstitial space shows such signs as vascular and bronchial blurring (cuffing) as well as septal lines (Kerley lines, arrows) and pleural fluid
|
|
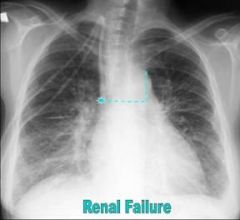
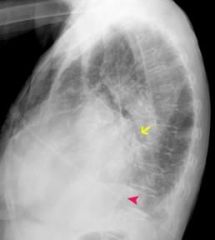
4q image indicates what?
|

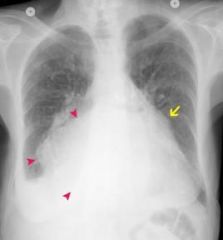
normal sized left ventricle (arrowhead), enlarged left atrium (arrow) indicative of mitral valve stenosis
|
|

5q image shows what? Indicative of what condition?
|
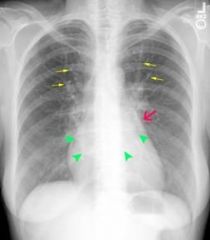
doubly density (arrowheads) of enlarged left atrium, bulge of atrial appendage (thick arrow) cephalized pulmonary flow (thin arrows), indicative of mitral valve stenosis
|
|
6q image shows what
|

markedly enlarged left atrium (arrowheads), moderately enlarged left ventricle, indicative of mitral insufficiency
|
|
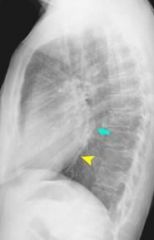
7q image indicates what
|

lateral view, arrow indicates enlarged left atrium displacing left lower lobe bronchus posteriorly. Arrowhead indicates enlarged left ventricle. indicates mitral insufficiency
|
|
8q image indicates what
|

large left atrium, arrowheads indicate “double density” of enlarged left atrium, arrow indicates enlarged left atrial appendage, indicative of mitral insufficiency
|
|

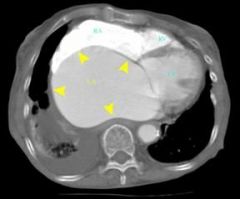
9q image shows what
|
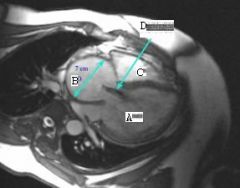
Enlarged LV (A) enlarged Aortic root (B) jet during regurgitation (D), RV is C
|
|

10q image shows what
|
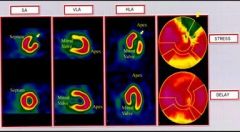
Thalium with area of ischemia (arrows) in the anterolateral LV wall that fillis in on the delayed study, indicating viable myocardium. bulys views (right column) represent data from the short axis sections collapsed into one vew to accentuate region of ischemia
|
|
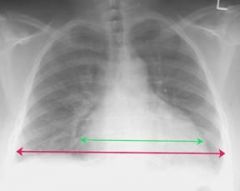
image048
|
image046
|
|
image050
|
image054
|
|
image052
|
image053
|
|
image057
|
image055
|
|
image059
|
image060
|
|
image063
|
image061
|
|
image065
|

image061
|