Reading...
![]()
Play button
![]()
Play button
![]()
Use LEFT and RIGHT arrow keys to navigate between flashcards;
Use UP and DOWN arrow keys to flip the card;
H to show hint;
A reads text to speech;
21 Cards in this Set
- Front
- Back
- 3rd side (hint)
|
parameter
|
numerical measurement describing some characteristic of a population
|
population
|
|
|
statistic
|
numerical measurement describing done characteristic of a sample
|
sample
|
|
|
population
|
compete collection of all measurements/data being considered
|
parameter
|
|
|
census
|
collection of data from every member of the population
|
|
|
|
sample
|
subcolllection of members selected from a population
|
|
|
|
quantitative data
|
numbers representing counts or measurements
|
numerical
|
|
|
categorical data
|
name's or labels that are not numbers representing counts or measurements
|
qualitative or attribute
|
|
|
discrete data
|
when data values are quantitative and the number of values is finite/countable
|
finite or countable, fewer
|
|
|
continuous (numerical) data
|
infinitely many possible values, where the collection of values is not countable
|
infinite, not countable, less
|
|
|
nominal measurement
|
data consisting of names, labels, or categories only. can't be arranged in ordering scheme
|
SSN, political party, yes/no/undecided
|
|
|
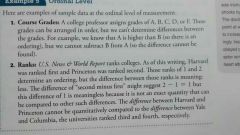
ordinal
|
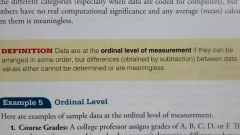
can be ordered, but differences (by subtraction) meaningless
|
|
|
|
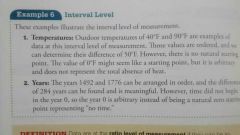
interval measurement
|
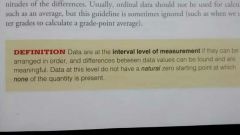
can be ordered, differences found and meaningful, no natural zero
|
|
|
|
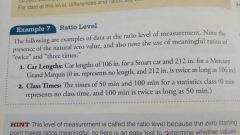
ratio measurement
|
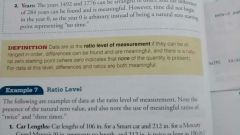
arranged in order, differences found and meaningful, and IS natural zero
|
|
|
|
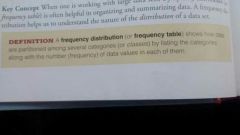
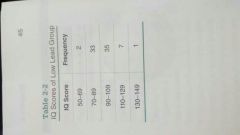
frequency distribution (table)
|
|
|
|
|
lower class limits
|
smallest number in different classes
|
|
|
|
upper class limits
|
largest number in classes
|
|
|
|
class boundaries
|
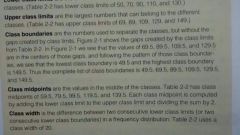
split the difference between the end of one class and beginning of the next
|
(upper class limit + next lower class limit)/2
|
|
|
class width
|
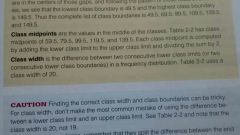
difference between two consecutive lower class limits
|
|
|
|
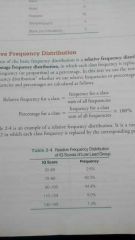
relative (percentage) frequency distribution
|
|
|
|
|
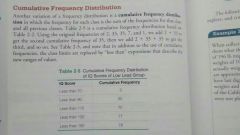
cumulative frequency distribution
|
|
|
|
|
histogram
|
graph of bars of equal width drawn adjacent to each other (unless gaps in data). Horizontal scale=classes; vertical scale=frequencies
|
|