![]()
![]()
![]()
Use LEFT and RIGHT arrow keys to navigate between flashcards;
Use UP and DOWN arrow keys to flip the card;
H to show hint;
A reads text to speech;
91 Cards in this Set
- Front
- Back
|
The General Linear Model equation
|
Yi = β0 + β1X1i + εi
|
|
|
The Generalized Linear Model equation
|
Logit(Y) = β0 + β1X1 + ε
|
|
|
What is the difference between the Generalized Linear Model and The General Linear Model wrt outcome?
|
Outcome is Yi for GLM and Logit(Y) for Generalized Linear Model
|
|
|
What are the types of logistic regression? (based on types of outcomes)
|
○ Binary logistic (2 categories)
○ Multinomial outcomes (3 or more categories) |
|
|
Binary logistic regression
|
Categorical or continuous variables and outcome is 2 categories
|
|
|
When do we use a logistic regression?
|
-Categorical/continuous/nominal variables (binary logistic or multinomial outcomes)
-Can look at interactions (same way you would in a linear regression) by computing product terms. DIFFERENCE is outcome is categorical/nominal. -Can look at interactions same way you would in a linear regression by computing product terms. |
|
|
Why do we use logistic regression?
|
"1. Prediction is going to be based on likelihood, not levels
2. Assumptions of ordinary least squares regression are violated by having a dichotomous variable. |
|
|
Non-Parametric Analyses: What are the Two Types of Chi-Square Tests?
|
Chi-square Goodness of Fit & Chi-square Test for Independence
|
|
|
Major violations of OLS assumptions that call for use of logistic regression
|
-Measurement assumption
-Linear assumption -Heteroscedastity and non-normal residuals -Scale of predicted score of the model needs to match the scale of the observed model |
|
|
Major violations of OLS: measurement assumption
|
Outcome is not on interval or ratio scale
|
|
|
Major violations of OLS: linear assumption
|
relationship between predicted values is assumed to be NON-linear.
|
|
|
Major violations of OLS: Heteroscedastity and non-normal residuals
assumption |
Variance in residuals is not consistent across the predictor. At extreme levels, the violation is bigger (see logistic regression curve)
|
|
|
Major violations of OLS: assumption that scale of predicted score of the model matches the scale of the observed model
|
Violated in logistic regression because we are predicting probabilities and not values of the outcome
|
|
|
Logistic Regression Curve
|
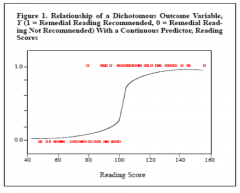
Variance in the residuals is not consistent across the predictor. At extreme levels, violation is bigger…. That represents heteroscedastity (violation of homoscedastity)
○ Distance between predicted and observed is not constant |
|
|
Logit(Y) = β0 + β1X1 + ε <--what is being predicted?
|
Predicting likelihood that outcome is either 0 or 1. Very similar to GLM and linear regression equation BUT uses the Logit(Y)
|
|
|
Probabilities/Odds: What is the range that probability can take?
|
"Expressed in a ratio from 0 to 1
□ 0 - definitely not going to happen □ 1 - definitely will happen |
|
|
Probabilities/Odds: What does P(Y=1) refer to?
|
Probability that event will happen (aka probabilty that Y will be classified as 1 on the DV)
|
|
|
Probabilities/Odds: Express P(Y=0) in terms of P(Y=1)
|
P(Y=0) = 1 - P(Y=1)
|
|
|
Probabilities/Odds: Why don't we use P(Y=1) = β0 + β1X1 + ε equation for logistic regression?
|
Problems with this are based on mathematical characteristics of probability --- observed and predicted values are restricted between 0 and 1. Predicted values may fall less than 0 (i.e. could get a negative probability).
|
|
|
Probabilities/Odds: What are the Odds?
|
Probability that Y = 1 relative to probability of Y =/= 1
P(Y=1)/(1- P(Y =1)) |
|
|
Probabilities/Odds: What does it mean if Odds are less than 1?
|
You're less likely to be categorized as a 1 than 0 on the DV
|
|
|
Probabilities/Odds: What is range of Odds?
|
Ranges from 0 --> 1 --> infinity.
|
|
|
Probabilities/Odds: What happens as the difference between P(Y) = 1 and P(Y)=/=1 gets bigger?
|
The bigger the diff between the two, the closer the odds ratio gets to infinity or 0!
|
|
|
Probabilities/Odds: What does it mean if Odds = 1, is > 1, or is <1, respectively?
|
= 1 equal likely to be in either condition
>1 = more likley to be in category coded as 1 <1 = more likley to be coded as a 1 than a 0 |
|
|
Probabilities/Odds: Why are odds better than Probability? Why are they still nonoptimal?
|
Better than probability because odds have no upper limit!
Nonoptimal because lower limit of 0 -- could create problems because you could get predicted values below 0. |
|
|
Probabilities/Odds: What is Logit?
|
Logit = Natural Logarithm of the odds
|
|
|
General Linear Model Equation
|
Yi = β0 + β1X1i + εi
|
|
|
General Linear Model: what is Yi?
|
Yi = the value of the DV or outcome; sometimes referred to as the expected value and denoted as Ŷ
Subscript “i” indicates that we are dealing with one score or case" |
|
|
General Linear Model: What is β0?
|
β0 = intercept term, constant effects, value of Y when all X’s are equal to zero.
|
|
|
General Linear Model: What is β1?
|
β1 = the regression coefficent for variable X, how much does X influence Y
|
|
|
General Linear Model: What is X1i?
|
X1i = the score of x for person or case i
|
|
|
General Linear Model: What is εi?
|
εi = residual, error, term. How far is the person’s actual score from the expected score
|
|
|
What is the logistic regression equation?
|
Logit(Y) = β0 + β1X1 + ε
|
|
|
What is the Generalized Linear Model?
|
-Used for analyses when OLS assumptions are not met
-Flexible generalization of ordinary linear regression that allows for response variables that have error distribution models other than a normal distribution - Allows the linear model to be related to the response variable via a link function (Logit) - Allows the magnitude of the variance of each measurement to be a function of its predicted value |
|
|
Non-Parametric Analyses: What are non-parametric tests & why are they used?
|
Make no assumptions about the parameters of the population the sample is drawn from
|
|
|
Non-parametric analyses: When are they used?
|
Used when assumptions of parametric analyses are violated (outcome variable is on interval/ratio scale, residuals are normally distributed/demonstrate homoscedasticity, linear, scale of predicted score is the same as scale of observed variable)
|
|
|
Non-parametric analyses: alternative to one-sample t-test
|
Chi-square Goodness of Fit
|
|
|
Non-parametric analyses: alternatives to independent samples t-test
|
Chi-square Test for Independence, Mann-Whitney (M-W) U Test
|
|
|
Non-parametric analyses: alternative to Paired-samples t-test
|
Wilcoxon Signed-Rank Test
|
|
|
Non-parametric analyses: alternative to Between Subjects Factorial ANOVA
|
Kruskal-Wallis Test
|
|
|
Non-Parametric Analyses: alternative to Repeated Measures Factorial ANOVA
|
Friedman Test
|
|
|
Non-Parametric Analyses: alternatives to Pearson’s Correlation Coefficient
|
Chi-square test for independence, logistic regression
|
|
|
Non-Parametric Analyses: alternative to Ordinary Least Squares regression
|
Logistic regression
|
|
|
Non-Parametric Analyses: What is Chi-square Goodness of Fit used for?
|
Uses sample data to test hypotheses about the shape or frequencies/proportions of a population distribution. Evaluates how well the obtained data fit the population proportions specified by the null (i.e., what is expected)
|
|
|
Non-Parametric Analyses: What are Chi-square Test for Independence used for?
|
Uses the frequency data from a sample to evaluate the relationship between two (nominal) variables in the population
|
|
|
Non-Parametric Analyses: How to calculate df for goodness of fit chi-square test
|
df = c – 1(c = number of categories)
|
|
|
Non-Parametric Analyses: How to calculate df for chi-square test of independence
|
df = (R-1)(C-1)(R = categories in the row variable; C = categories in the column variable)
|
|
|
Why do we use logistic regresion?
|
Having a dichotomous variable violates many of the assumptions of OLS regression --> Prediction is going to be based on likelihood, not levels
|
|
|
Probabilities/Odds: How to convert from probabilities to logit?
|
P(Y=1)/P(Y=0) = P(Y=1)/(1-P(Y=1)<--odds
LN(P(Y=1)/(1-P(Y=1)) <--logit |
|
|
Probabilities/Odds: How to convert from logit to probability?
|
Odds (Y) = elogit(y)
P (Y=1) = elogit(y)/(1+elogit(y)) |
|
|
Probabilities/Odds: Probabilities/Odds: LN(0) = LN(small#) = LN(.98) =
LN(1) = LN(larger numbers) = |
"LN(0) = undefined. "the limit does not exist!"
LN(.00001) is really negative LN(.01) is negative LN(.98) = increasing towards 0 LN(1) = 0 LN(larger numbers) = gets larger" |
|
|
What are the primary assumptions of logistic regression?
|
Shared with OLS assumptions:
1. specificity assumption - model contains all relevant predictors and no irrelevant predictors. This is easier said than done, and often violated. 2. multicollinearity - still bad. Specific to logistic regression 3. Outcomes must be statistically independent - a case can only be in one category (e.g. one cannot be both male and female). 4. Mutually exclusive and collectively exhaustive - a case cannot be in more than one category AND every case must be in one category (e.g. alive or dead) |
|
|
What are the three broad pieces of information that are provided by a logistic regression analysis?
|
Shared with OLS assumptions:
1. Model fit - How well do all of the variables in the model together predict the outcome 2. Regression coefficient - What is the influence of each individual predictor in accounting for the outcome Specific to logistic regression 3. Classification - How well does the model correctly classify cases into target (1) and non-target (0) group. We'll talk about this more later…. |
|
|
What is an odds ratio & how do you interpret it in logistic regression?
|
• analogous to a standardized regression coefficient in OLS regression
• Estimates the increase (or decrease) in odds of membership in the target group for a one-unit increase in the predictor while controlling for the other predictors in the model |
|
|
What does an odds ratio of greater than 1 mean in logistic regression?
|
Increase in the likelihood of being in the target group as the predictor increases
|
|
|
What does an odds ratio of 1 mean in logistic regression?
|
No impact of the predictor on the outcome
|
|
|
What does an odds ratio of less than 1 mean in logistic regression?
|
Decrease in the likelihood of being in the target group as the predictor increases
|
|

"Classification: Sensitivity = "
|
Sensitivity = 100 * (d/(b+d))
|
|
|
Classification: Sensitivity is...
|
Correct identification of true positives
|
|

Classification: Specificity is...
|
correct identification of true negatives
|
|
|
"Classification: Specificity = "
|
specificity = 100 * (a/(a + c))
|
|

"Classification: Positive Predictive Value = "
|
Positive Predictive Value = 100 * d/(c+d)
|
|
|
Classification: Positive Predictive Value is...
|
percent of predicted 1 that are 1
|
|

"Classification: Negative Predictive Value = "
|
Negative Predictive Value = 100 * (a/(a + b))
|
|
|
Classification: Negative Predictive Value is...
|
percent of predicted 0 that are 0
|
|
|
EFA/PCA: What are some design issues to consider when planning a PCA or EFA study?
|
1. Sample size
2. Number of variables/indicators per common factor (EFA): 3-5 per factor 3. Content validity4. Measurement |
|
|
EFA/PCA: what are sample size recommendations?
|
At least 100 participants and STV >= 5(Subject-to-variables ratio = STV ratio).
|
|
|
EFA/PCA: what are recommended number of variables/indicators per common factor?
|
3-5 per factor
|
|
|
EFA/PCA: what are content validity considerations?
|
-Inadequately covering all domains of interest could lead to the failure to identify relevant common factors
-Including irrelevant variables could lead to the false identification of irrelevant common factors to the construct of interest |
|
|
EFA/PCA: what are measurement considerations?
|
Variables should be measured at interval or ratio level
|
|
|
EFA/PCA: What are the four steps of conducting a PCA/EFA?
|
1. Choose an estimator/extraction method
2. Determine number of factors 3. Select a rotation 4. Interpret solution (may need to repeat steps 2 and 3) |
|
|
EFA/PCA: Most commonly used extraction procedures
|
Maximum likelihood
Principle axis factoring |
|
|
EFA/PCA: criteria for choosing the correct number of factors
|
1. Kaiser-Guttman Rules (eigenvalues over 1) =>eigenvalues measure total variance
2. Scree test (“scree plot”, really) => identify where the plot levels off 3. Interpretability" |
|
|
EFA/PCA: What is the purpose of rotation?
|
-The goal of rotation is to redefine the factor loadings to obtain simple structure
-Each factor should have indicators with strong loadingso Each indicator should load strongly on only one factor -Helps with interpretability |
|
|
EFA/PCA: difference between orthogonal and oblique rotation
|
• Orthogonal - uncorrelated factors
• Oblique - correlation among factors" |
|
|
EFA/PCA: What two things that guide interpretation of factors?
|
• Theoretical interpretation => do the factors and constructs make sense from theory?
• Obtain simple structure |
|
|
EFA/PCA: What is simple structure?
|
• Each factor should have indicators with strong loadings
• Each indicator should load strongly on only one factor |
|
|
EFA/PCA: What is the characteristic of a bad factor?
|
A good factor has AT LEAST three items that significantly load onto it and no other factors; bad factor has 2 or less
|
|
|
EFA/PCA: What are two types of bad indicators/items?
|
• Items that do not load onto any factor
• Items that load onto two or more factors |
|
|
CFA/SEM: What is the primary distinctions between EFA and confirmatory factor analysis (CFA)?
|
• EFA is a “bottom-up” or data-driven process. The analyst submits the data to EFA, and EFA dictates the results.
• CFA is a “top-down” or theory-driven process. The analyst a-prior specifies the model to be tested, and the CFA provides information about how well the data fit the specified model. |
|
|
CFA/SEM: What are the primary advantages of CFA over EFA?
|
• More methodologically rigorous
• CFAs are theory driven and more specific (and more parsimonious) than EFAs • Likelihood of obtaining good model fit is reduced; HOWEVER, we can have more confidence in CFA solutions than EFA solutions and they are more likely to replicate across samples • Provides ABSOLUTE and RELATIVE goodness of fit indicators • More flexible (can do a lot more)• Can evaluate INVARIANCE • Maps onto construct validity very well • Produces UNSTANDARDIZED, as well as standardized solution • Can incorporate error theory |
|
|
CFA/SEM: CFA/Structural Equation Modeling (SEM) Graphical Notation - what does square represent? what about circle?
|
Squares for indicators, circles for factors
|
|
|
CFA/SEM: CFA/Structural Equation Modeling (SEM) Graphical Notation - what do bidirectional arrows indicate? unidirectional?
|
bidirectional arrows for correlations, unidirectional arrows for factor loadings/directional relationships
|
|
|
CFA/SEM: CFA/Structural Equation Modeling (SEM) Graphical Notation - Double Arrow Curve with both ends pointing to same latent variable
|
variance of latent variable
|
|
|
CFA/SEM: Factor Loadings
|
o The effect of the factor on the observed variableo Indicates how well the indicator “represents” or loads onto the factor
o CFA provides significance tests for factor loadings and provides standardized (-1 to 1) and unstandardized estimates" |
|
|
CFA/SEM: error variances
|
Error variance = the residual, error term, or unique variance. How much of the observed variable or indicator is NOT accounted for by the factor
|
|
|
CFA/SEM: error covariances
|
Associations among residual terms
|
|
|
CFA/SEM: Factor variance
|
How much variability is there in the factor across participants
|
|
|
CFA/SEM: Factor covariance
|
The degree to which factors are associated (correlated)
|
|
|
CFA/SEM: what is the Structural Component of SEM?
|
the factor relationships to each other
|
|
|
CFA/SEM: what is the Measurement Component?
|
the relationship of indicators to factors
|